Nifty and Bank Nifty future trading - Time tested strategy

#21
Sanju, Paliorocks is a nice site. Thanks for sending the link. But apart from intraday, EMAs can be good for positional nifty. As per my system, I enter by 1 day chart and hold my position watching the 5 days chart. Sometimes, after nifty making a big intraday move keep quite for 2/3 trading sessions and remains rangebound and choppy. Most traders give up the gains they have made during the choppy market. Thats why I use 5 days chart as exit as it helps me in holding my position instead of entering and exiting every now and then.

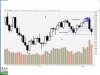
Asides to Kiran, 3 EMA can frequently cross 13 if the trend is not so strong, but 13 seldom crosses 34 in whipsaws. Better to enter a position when all the following things happen:
  1. EMA channel crossover happens
  2. RSI crossing above or below 50
  3. Stoch crossing above or below 50 in the same direction of nifty and RSI
  4. 5 days chart RSI and Stoch also moves in the same direction crossing mid-point.

In this way most of the time we can avoid the choppy market. The same system can be used in trading Bank Nifty which is nowadays more volatile than Nifty.

Regards,

Indrajit
brother, i am new in nifty tading after couple of paper trading weeks
i tading like--
for nifty positional
i long nifty till it brks previous day low and viceversa for short postn
...jst sharing my exp only
 

Attachments

Last edited by a moderator:
#22
Kiran thanks a lot for taking time to create a back testing. I am not a big master of Amibroker. I will see your formula and will get back to you in 2/3 days. For the time being, pls go through my post in previous page http://www.traderji.com/technical-analysis/25813-nifty-bank-nifty-future-trading-time-tested-strategy-2.html.

My system is on Yahoo Basic Chart. TF 5 mins; EMAs used 3 min/13 min/34 min. You must have used ema3/13/34. Those emas are in periods and create a lot of whipsaw as shown in the yahoo interestive chart. Just compare the same day's basic chart and interactive chart.

Also, human eyes are better than amibroker formulas. Say R<70 and R>50. But I will never enter a trade where RSI is at 69 and about to kiss 70 mark.

Regards,

Indrajit
 
Last edited by a moderator:
#23
Kiran, another thing, can u just generate buy and sell signals using the afl file and post the screenshot to the forum. Time frame - 5 mins, total data - 5 days, emas - 3/13/34, indicators used - rsi, macd, slow stoch.

Regards,

Indrajit
 
Last edited by a moderator:
#24
Friends,

Hardly getting any time to update recent trades. Will update today's nifty trades graphically tomorrow morning. Excuse me for the delay.

Regards

Indrajit

With more powerful Real Time Nifty Chart
 
Last edited by a moderator:
#25
dear indrajeet,
nice strategy. I liked it. pl.clear my doubt.What will happen if
intraday position is sqared up on intraday yahoo fin. MACD chart
instead of 5day MACD as said in your page.
saurabh
 
#26
Friends,

Actually market is moving in very narrow range for the last few days and there was hardly any opportunities as per the system. Yesterday, I felt there was only one opportunity for traders and tried to represent it graphically.

Just see the MACD in the 5 days chart to feel the range bound movement.


Regards,

Indrajit

Now with more powerful nifty intraday chart.
 
Last edited by a moderator:
#27
Sourabho,

Actually this system is a bit conservative. A buy and hold for 2/3 sessions type. I am also a conservative trader and dont enter until all parameters coincide (EMAs crossed+RSI and MACD upwards).Hence, if you close a profitable position intraday, next day you can miss a gap up or down 50 points and market may remain range-bound whole day giving hardly any opportunity for you to enter any new trade as per his system.

So, this is not for compulsive traders. I always recommend trading even numbers of lots, so that you can square off 50% when you have reached a good support/resistance level and carry on the rest with SL at YOUR COST PRICE for more gains.

Regards,

Indrajit
 
Last edited by a moderator:
#28
Hi Indrajit,
First of all thanks for sharing your system. It definitely needs a lot of conviction in one's method/system to not only share it on a public forum but also follow up with the trades generated. I appreciate your attitude.
i have also been trying to work out a EMA crossover system for last few days. Hopefully would share it with you for your inputs after i have put in little more work.
Lets Rock
 
#29
Friends,

I just wanted to share another good trade example happened on 21st of January. Your comments are welcome on the subject. :confused:


Regards,

Indrajit
 
Last edited by a moderator:
V

vvvv

Guest
#30
how do u account for gaps like 4% up 1 day & then 3% down the next day....monstrous gaps nowadays are very frequent in nifty fut.
with these huge gaps,all ur indicators will show u the wrong direction...as u said u r trading on 5 min chart..u have a huge gap up ..indicator shows buy...but i find nifty going down the whole ...it has happened so many times...how do u tackle tht.
 

Similar threads