


Hi all,
I've been learning the Elliott Wave Principle for some time now, and i ran into this chart (attached) and the text, that describes it, says:
"Wave (I) is a fairly clear "five," assuming 1789 to be the beginning of the Supercycle. Wave (II) is a flat, which neatly predicts a zigzag or triangle for wave (IV), by rule of alternation."
So, my question is: Is wave (II) really look like a flat? Does it make any sense?
THX.
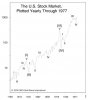
Attachments
-
 27.2 KB Views: 37
")