Hi,
I have been trading since last 4-5 months and following various threads in this forum since beginning. I read few articles and books on Technical Analysis and I spend few hours every day analyzing charts. Here I would like to present my analysis on Nifty and request you to comment, correct my work. Would really appreciate guidance from seniors and every one. Please follow the attached chart:
So far:
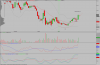
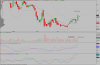
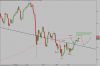
1. Nifty formed Inverted Head & Shoulders pattern on daily charts since Feb end
2. Gave a +ve breakout on 17th April, closing above neckline and sustained it since then
3. Hit resistance at 200 DMA today (28th April)
Looking ahead:
1. Should see a dip in a week to re-test the neckline
2. Should head upto 5500, if it could breach resistance levels at the then 200DMA and another strong resistance at around 5368
Thanks,
KB
I have been trading since last 4-5 months and following various threads in this forum since beginning. I read few articles and books on Technical Analysis and I spend few hours every day analyzing charts. Here I would like to present my analysis on Nifty and request you to comment, correct my work. Would really appreciate guidance from seniors and every one. Please follow the attached chart:
So far:
1. Nifty formed Inverted Head & Shoulders pattern on daily charts since Feb end
2. Gave a +ve breakout on 17th April, closing above neckline and sustained it since then
3. Hit resistance at 200 DMA today (28th April)
Looking ahead:
1. Should see a dip in a week to re-test the neckline
2. Should head upto 5500, if it could breach resistance levels at the then 200DMA and another strong resistance at around 5368
Thanks,
KB
Attachments
-
 38.1 KB Views: 99