Traderji.com - Discussion forum for Stocks Commodities & Forex

need help!! candle stick chart

Discuss need help!! candle stick chart at the Technical Analysis within the Traderji.com - Discussion forum for Stocks Commodities & Forex; Hi guys, can someone help me to interpret the candle stick of this chart? What ...


Go Back   Traderji.com - Discussion forum for Stocks Commodities & Forex > METHODS & STRATEGIES > Technical Analysis

Notices

Technical Analysis Discussion of all the principles involved in technical analysis.


Advertise Here

Reply
 
Thread Tools
Sponsored Links
  #1  
Old 20th March 2005, 06:20 PM
Member
 
Join Date: Jan 2005
Posts: 123
Thanks: 0
Thanked 0 Times in 0 Posts
cmlee is on a distinguished road
Reputation: 20
Default need help!! candle stick chart

Hi guys,
can someone help me to interpret the candle stick of this chart?
What will happen next? price drop further?
thanks
Attached Images
File Type: jpg h1.jpg (60.7 KB, 49 views)
Reply With Quote
Sponsored Links
  #2  
Old 20th March 2005, 07:00 PM
Member
 
Join Date: Mar 2005
Posts: 2
Thanks: 0
Thanked 0 Times in 0 Posts
Satinder is on a distinguished road
Reputation: 20
Default Re: need help!! candle stick chart

Hi Lee

Yes according to me the prices would fall as per just viewing your charts. Even if you want then I can help you out in pin pointing its target price. just post the scrip code of the stock as well as listed in NSE or BSE & I will post the target price if I get the data for the same.

Regards
Reply With Quote
  #3  
Old 21st March 2005, 07:31 AM
Super Moderator
 
Join Date: Jun 2004
Posts: 1,765
Thanks: 0
Thanked 106 Times in 18 Posts
Traderji has disabled reputation
Reputation: 157
Default Re: need help!! candle stick chart

Quote:
Originally Posted by cmlee
Hi guys,
can someone help me to interpret the candle stick of this chart?
What will happen next? price drop further?
thanks
On the contrary I think the stock has bottomed out (see the long tails on the last two candle bars), also I see a bullish divergence forming in the histogram indicator.
__________________
Best Wishes!

Traderji

www.Traderji.com
Reply With Quote
  #4  
Old 25th March 2005, 05:52 PM
Member
 
Join Date: Jan 2005
Posts: 123
Thanks: 0
Thanked 0 Times in 0 Posts
cmlee is on a distinguished road
Reputation: 20
Default Re: need help!! candle stick chart

how about this?
will the price drop further the next day, continuing the downtrend?
Attached Images
File Type: jpg untitled.jpg (42.0 KB, 25 views)
Reply With Quote
  #5  
Old 25th March 2005, 08:08 PM
Member
 
Join Date: Feb 2005
Location: all over india but mostly in delhi
Posts: 20
Thanks: 0
Thanked 0 Times in 0 Posts
junky is on a distinguished road
Reputation: 20
Default Re: need help!! candle stick chart

Hi guys,
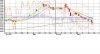
On the querry from Lee I tend to agree with Traderji. The signs of bottoming up are there but it is not confirmed as no morning star or doji has occurred. Candlestick is a beutifull representation of investors sentiments and the first chart suggest that though majority would like to even buy the stock at highr prices, the firm consesus has yet not emerged.


with regards from junky
Reply With Quote
Sponsored Links

Reply

Bookmarks


Advertise Here


Thread Tools

Posting Rules
You may not post new threads
You may not post replies
You may not post attachments
You may not edit your posts

BB code is On
Smilies are On
[IMG] code is On
HTML code is Off
Trackbacks are Off
Pingbacks are Off
Refbacks are Off

Similar Threads for: need help!! candle stick chart
Thread Thread Starter Forum Replies Last Post
Price bars and Bar Chart Traderji Technical Analysis 3 30th September 2007 01:47 PM
Recommended Books on Technical Analysis Traderji Books 40 6th September 2007 01:21 AM
ARVIND MILLS - Symm Triangle vikasdewan Trading on Technicals 4 23rd May 2005 03:30 PM
FREE DATA & CHART a_n_i_l Software 6 25th September 2004 04:55 PM


All times are GMT +5.5. The time now is 01:01 AM.

Indemnity, Disclaimer & Disclosure Notice:
• By visiting Traderji.com you indicate your acceptance of our Forum Rules Disclaimer & Disclosure and indemnify Traderji.com, its associates and related parties of all claims howsoever resulting from the usage of the forum.
Disclaimer: Trading or investing in stocks & commodities is a high risk activity. Any action you choose to take in the markets is totally your own responsibility. Traderji.com will not be liable for any, direct or indirect, consequential or incidental damages or loss arising out of the use of this information.
Disclosure: The information in this forum is neither an offer to sell nor solicitation to buy any of the securities mentioned herein. The writers may or may not be trading in the securities mentioned.
• All names or products mentioned are trademarks or registered trademarks of their respective owners.
General Content Disclaimer Notice:
In light of our policy of encouraging candid, open exchanges of views and the rapid distribution of information originating from many sources, Traderji.com cannot determine the accuracy of information that may be uploaded to the forum. Opinions, advice and all other information expressed by participants in discussions are those of the author. You rely on such information at your own risk. You are urged to seek professional advice for specific, individual situations and not rely solely on advice or opinions given in the discussions. Since Traderji.com is an open and free discussion forum, any comments made by members of this forum in their posts reflect their own views and not of the owner or administrator of Traderji.com. Thus the owner/administrator indemnify themselves of all claims whatsoever and will not be liable or responsible for any members comments/views in this forum Traderji.com. If you find any objectionable or offensive posts made by members of this forum which you would like to bring to our notice for removal then please Contact Us.


Copyright © 2001 - 2008, Traderji.com All Rights Reserved.

Recommended Websites - www.TradersEdgeIndia.com - www.TradingPicks.com - www.MasterOfTrading.com