


H index
- Thread starter razkevich
- Start date
Hello friends!
I'm looking for indicator commonly mentioned as Hurst indicator.
It would calculate Hurst index discribed by Edgar Peters ("Chaos and Order in the Capital Markets","Fractal Market Analysis").
Maybe someone has it or knows where to get it.
Anyway thanks!
I'm looking for indicator commonly mentioned as Hurst indicator.
It would calculate Hurst index discribed by Edgar Peters ("Chaos and Order in the Capital Markets","Fractal Market Analysis").
Maybe someone has it or knows where to get it.
Anyway thanks!
I am not sure whether you are refering to Arps Hurst Bands as H index. If it is same as Hurst Bands then the explanation is as follows:
It plots a series of curves above and below a ploynomial regression curve. The polynomial regression curve can be of any degree ( 2, 3 , 4 etc). If it is of degree 1 then it is linear regression. The curves above and below this central regression line are drawn at a distance of 1, 2 and 3 standard deviations. The lines above act as resistance lines and those below act as support lines. The price tries to come back to the centre line. Statistically, the probability of the price remaining within the inner most bands is 66%, within the middle pair is 95% and within outermost pair is 99%.
This probability can be used to enter and exit the trades. Suppose the price has touched or crossed above the middle band (2 sigma level) the chance of its coming down is 95% while it has only 5% chance of continuing above this level. Similarly if the price goes above the outermost level it has only 1% chance of remaining there. Therefore, you can go short or close your long position with a risk factor of 1%.
As the regression calculations are very time consuming, it is a general practice to restrict the calculations to most recent bars, say about 150 bars. Generally, last 75 to 150 bars give good results.
The selection of degree of polynomial and look back period are to be optimised as per individual choice and the bands for trading are chosen as per risk taking capacity.
I hope this is what you were looking for. If you or any other members come across something more informative, please post it here in this thread.
Regards
-Anant
Hello, Anant, thanks for reply!!
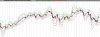
Actually, this is not exactly what i was looking for, but nevertheless what you described is extremely interesting. These bands are similar to bollinger bands (especially in case of linear regression) - if i understand you correctly, we just use Linear Regression Indicator instead of moving average - so that it should look like in the attachment.
In metastock language it will look like:
LinearReg(C,13)+Stdev(C,13);
LinearReg(C,13)+2*Stdev(C,13);
LinearReg(C,13)+3*Stdev(C,13);
LinearReg(C,13)-Stdev(C,13);
LinearReg(C,13)-2*Stdev(C,13);
LinearReg(C,13)-3*Stdev(C,13);
Am I right?
By the way, about the probabilities: Price stays within middle bands in 95% of cases but it slides along the band quite often. So the probability of price bounce (going down of up from the band) is much less then 95%. Otherwise it would have been too easy))
But definitely it looks much better then bollinger bands. this is because linear regression is much more adoptive to rapid price change then MA.
I think it's valuable thing to use it to define OB/OS levels or estimate potential movement size to define TakeProfit levels or manage risks.
Last time i was thinking of applying polynomial linear regression (eg for some stock its parameters could be indices, related commodities etc.) but i's so lazy). did you try something about it?
Thanks for good idea, i also have good idea for you!))
Attachments
-
 61.1 KB Views: 116
(attachment)
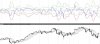
At first sight it looks complicated but it's not. There are
1) slightly modified Detrended Indicator (blue)
2) standart deviations: 2*stdev (green); -2*stdev (red); 1*stdev; and -1*stdev (both gray)
This is my improvement (hopefully) of Bollinger Bands. While Bollinger Bands are commonly determined as MA + 2*SD (and MA - 2*SD) with price walking between (and beyond) them, in this case we have detrended Price (=Price-MA - Detrended Indicator) and Standard Deviation (detrended MA+2*SD: MA+2*SD-MA=2*SD).
The first application of my indicator is determining tops and bottoms. Using Bollinger Bands for this purpose is not a very good idea because in most cases price slides down or up the band. And the goal is that we can make stdev be less treacherous by increasing its period (and leaving detrended period invariable). Thus in the picture we have (-2;+2;-1;+1)*stdev(13) and detrended(8). And detrended will often swing from stdev and double stdev. For best result parameters should differ by 1,62 for example 8 and 13, 21 and 34 etc. It happens often enough (in 50-60% of cases acc. to my observations) to ignore it.
Also it's great to define Overbought/Oversold situations because OB/OS level is not static but it adopts to current market situation (to current volatility)
Also it's another technique to find low price volatility. It's common knowledge that volatility changes from high to low (it's antipersistent according to mr.edgar). So when standard deviation stays abnormally low for some period you can expect explosive movement.
it would be great to know you ideas and comments!!
From Russia with love))
Attachments
-
 67.4 KB Views: 104
take a look.... this is wht it can do.
I have already tried the AFL with different degrees. It draws the regression line using all the data. What we need for Hurst Bands is a plot of plynomial fit over a fixed period such as 10 bars or 25 bars etc. Preferably, the period should be selectable via the Param() function. For an example see the attached chart of ACC. It is a 20-period Linear fit.
Regards
-Anant
Last edited:
Similar threads
-
latest constituents of index and their weightage
- Started by bhartesh
- Replies: 3
-
-

-
Keep trying Index F&O day trading or quit
- Started by random2405
- Replies: 1
-
 Needed 1 min Intraday Index (Nifty & Banknifty) Option data
- Started by letsgrownow
- Replies: 5