How to Use ADX??

#1
Hi Friends,

I am confused with ADX need some help.

About ADX:
The ADX is an oscillator that fluctuates between 0 and 100.

Low readings, below 20, indicate a weak trend and
High readings, above 40, indicate a strong trend.

The indicator does not grade the trend as bullish or bearish, but merely assesses the strength of the current trend.

--------------------------
I have attached two examples:
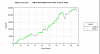
In IFCI:
If I look overall there is a strong upward trendline,

But look at the ADX, the circle area is that where the ADX was moving from 10-30.

What should I do now?? When to enter/exit?


In ONGC:
Look at the circled area of ADX there the prices was at a perfect trading range.


How do I follow this indicator?
Is there any other indicator which can be use with ADX for better result?

Regards,
Luckytrader
 
Last edited:

Traderji

Super Moderator
#4
I prefer to use the ADX to know when to trade with other Technical Indicators! Anyways here is some food for thought...

The ADX gives important information on the market environment. Without being acutely attuned to the market environment you are doomed to fail.

The ADX gives you market environment information par excellence. The ADX tells you if there is a trend present or not. It also informs you if it is early or late in a trend. The end of the most recent thrust of the trend is heralded by the ADX. It informs of a de-trending (correcting market), of reversal and renewal. Wilder calculated that markets trend for 30% or less of the time and were non-trending or range bound for the other 70% of the time. Trend following indicators are lethal in non-trending markets and oscillators suitable to non-trending markets are murderous if used in trending markets. So with reference to the ADX you can readily determine which of the two main types of indicators you should be using in the current market environment.

The table indicates the appropriate type of indicator for different ADX defined market environments.

ADX Score ADX Direction Appropriate Tech. Indicator to Use
0 - 15 Up or Down Range - Use Oscillators
16 - 20* Up Trend - Use Trend Following Indicators
21 - 40 Up Trend - Use Trend Following Indicators
> 40** Up Be Prepared For Trend To End
> 40 - 25 Down De-trending - Use Oscillators
24 - 0 Down Non-trending - Use Oscillators

* J.Welles Wilder originally suggested ADX of 25 or higher to indicat presence of trend. This is often late in confirming trend entry. Trends emerge from non-trends. I have found it appropriate if, in the range 16 - 20(25), you have three consecutive up moves in the ADX prior to a DI entry crossover, then the DI entry can be taken with a high degree of success.

** The turn down of the ADX at these levels, when it above both DI lines, almost always means the end of that trend. It does not necessarily mean trend reversal, more likely a period of retracement and consolidation. Time to exit. Stand aside. Reverse only on other evidence of trend reversal.
 
U

uasish

Guest
#5
Traderji,
Kindly share your findings of ADX in Intraday.
"I have found it appropriate if, in the range 16 - 20(25), you have three consecutive up moves in the ADX prior to a DI entry crossover, then the DI entry can be taken with a high degree of success."
Does this hold true in Intraday 5mins Time - Frame.


Asish
 
#7
Thanks traderji

for solving such a complicated one

The ADX gives you market environment information par excellence. The ADX tells you if there is a trend present or not. It also informs you if it is early or late in a trend. The end of the most recent thrust of the trend is heralded by the ADX. It informs of a de-trending (correcting market), of reversal and renewal. Wilder calculated that markets trend for 30% or less of the time and were non-trending or range bound for the other 70% of the time. Trend following indicators are lethal in non-trending markets and oscillators suitable to non-trending markets are murderous if used in trending markets. So with reference to the ADX you can readily determine which of the two main types of indicators you should be using in the current market environment.

The table indicates the appropriate type of indicator for different ADX defined market environments.

ADX Score ADX Direction Appropriate Tech. Indicator to Use
0 - 15 Up or Down Range - Use Oscillators
16 - 20* Up Trend - Use Trend Following Indicators
21 - 40 Up Trend - Use Trend Following Indicators
> 40** Up Be Prepared For Trend To End
> 40 - 25 Down De-trending - Use Oscillators
24 - 0 Down Non-trending - Use Oscillators
Now I understood by ADX I will first decide whether the scrip is in trending mode or Trading, then I will apply diff. indicators.

Regards,
Luckytrader.
 
#8
I prefer to use the ADX to know when to trade with other Technical Indicators! Anyways here is some food for thought...

The ADX gives important information on the market environment. Without being acutely attuned to the market environment you are doomed to fail.

The ADX gives you market environment information par excellence. The ADX tells you if there is a trend present or not. It also informs you if it is early or late in a trend. The end of the most recent thrust of the trend is heralded by the ADX. It informs of a de-trending (correcting market), of reversal and renewal. Wilder calculated that markets trend for 30% or less of the time and were non-trending or range bound for the other 70% of the time. Trend following indicators are lethal in non-trending markets and oscillators suitable to non-trending markets are murderous if used in trending markets. So with reference to the ADX you can readily determine which of the two main types of indicators you should be using in the current market environment.

The table indicates the appropriate type of indicator for different ADX defined market environments.

ADX Score ADX Direction Appropriate Tech. Indicator to Use
0 - 15 Up or Down Range - Use Oscillators
16 - 20* Up Trend - Use Trend Following Indicators
21 - 40 Up Trend - Use Trend Following Indicators
> 40** Up Be Prepared For Trend To End
> 40 - 25 Down De-trending - Use Oscillators
24 - 0 Down Non-trending - Use Oscillators

* J.Welles Wilder originally suggested ADX of 25 or higher to indicat presence of trend. This is often late in confirming trend entry. Trends emerge from non-trends. I have found it appropriate if, in the range 16 - 20(25), you have three consecutive up moves in the ADX prior to a DI entry crossover, then the DI entry can be taken with a high degree of success.

** The turn down of the ADX at these levels, when it above both DI lines, almost always means the end of that trend. It does not necessarily mean trend reversal, more likely a period of retracement and consolidation. Time to exit. Stand aside. Reverse only on other evidence of trend reversal.
I have read original original book of Mr J Welles Wilder. He suggest that market having value of ADXR above 25 is trending. ADXR is eqaul to (adx(14)+Ref(adx(14),-1)/2. However, people are using ADX as measure of trending market. Comments please.
 

hardik0007

Well-Known Member
#10
Dear pradeepsnayaka,

Traderji ROCKS!!!!

ADX explained very well over here
and u wanna know more about ADX just type question, i will like to help you
 

Similar threads