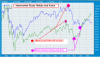
Sunil's query "Will Autos follow suit?"
Ajay's remarks "Correlation does not lead to a cause effect relationship, it results from it "
Here i felt a little elaboration may help our newer members :=
This is what Ajay wanted to infer := Even in the science of Probability....
Bayesian inference
To illustrate, suppose there are two bowls full of cookies. Bowl #1 has 10 chocolate chip and 30 plain cookies, while bowl #2 has 20 of each. Our friend Fred picks a bowl at random, and then picks a cookie at random. We may assume there is no reason to believe Fred treats one bowl differently from another, likewise for the cookies. The cookie turns out to be a plain one. How probable is it that Fred picked it out of bowl #1?
Before observing the cookie, the probability that Fred chose bowl #1 is the prior probability, P(H1), which is 0.5. After observing the cookie, we revise the probability to P(H1|D), which is 0.6.
It's worth noting that our belief that observing the plain cookie should somehow affect the prior probability P(H1) has formed the posterior probability P(H1 | D), increased from 0.5 to 0.6. This reflects our intuition that the cookie is more likely from the bowl 1, since it has a higher ratio of plain to chocolate cookies than the other. The decision is given as a probability, which is different from classical statistics.
Hence Sunil's Query may be intuitive.
Now let us see in this :=
FALSE POSITIVES IN A MEDICAL TEST:=
False positives result when a test falsely or incorrectly reports a positive result. For example, a medical test for a disease may return a positive result indicating that patient has a disease even if the patient does not have the disease. We can use Bayes' theorem to determine the probability that a positive result is in fact a false positive. We find that if a disease is rare, then the majority of positive results may be false positives, even if the test is accurate.
Suppose that a test for a disease generates the following results:
If a tested patient has the disease, the test returns a positive result 99% of the time, or with probability 0.99
If a tested patient does not have the disease, the test returns a negative result 95% of the time, or with probability 0.95.
Suppose also that only 0.1% of the population has that disease, so that a randomly selected patient has a 0.001 prior probability of having the disease.
We can use Bayes' theorem to calculate the probability that a positive test result is a false positive.
So this is the limitation of Classical Probability .
Now let us see in actual field the use of 'Bayes Theorem'
In May 1968 the US nuclear submarine Scorpion (SSN-589) failed to arrive as expected at her home port of Norfolk, Virginia. The US Navy was convinced that the vessel had been lost off the Eastern seaboard but an extensive search failed to discover the wreck. The US Navy's deep water expert, John Craven USN, believed that it was elsewhere and he organised a search south west of the Azores based on a controversial approximate triangulation by hydrophones. He was allocated only a single ship, the Mizar, and he took advice from a firm of consultant mathematicians in order to maximise his resources. A Bayesian search methodology was adopted. Experienced submarine commanders were interviewed to construct hypotheses about what could have caused the loss of the Scorpion.
The sea area was divided up into grid squares and a probability assigned to each square, under each of the hypotheses, to give a number of probability grids, one for each hypothesis. These were then added together to produce an overall probability grid. The probability attached to each square was then the probability that the wreck was in that square. A second grid was constructed with probabilities that represented the probability of successfully finding the wreck if that square were to be searched and the wreck were to be actually there. This was a known function of water depth. The result of combining this grid with the previous grid is a grid which gives the probability of finding the wreck in each grid square of the sea if it were to be searched.
This sea grid was systematically searched in a manner which started with the high probability regions first and worked down to the low probability regions last. Each time a grid square was searched and found to be empty its probability was reassessed using Bayes' theorem. This then forced the probabilities of all the other grid squares to be reassessed (upwards), also by Bayes' theorem. The use of this approach was a major computational challenge for the time but it was eventually successful and the Scorpion was found in October of that year
Now the confusion part ,the finding may had been 'Random'
So back to sq 1 & i cant say whether Sunil or Ajay's inference is TRUE or FALSE , but even by 'Bayes' or 'Random' Ajay's inference is more probable to be TRUE.
Asish


 29.3 KB Views: 44
")