![]() |
| Discuss Price-Volume Relationship- A Different Perspective. at the Technical Analysis within the Traderji.com - Discussion forum for Stocks Commodities & Forex; I experiment a lot on Excel and one of my favorites is to study the ... |
|
|||||||
| Register | Blogs | FAQ | Chat Room | Search | Today's Posts | Mark Forums Read |
| Technical Analysis Discussion of all the principles involved in technical analysis. |
|
Welcome to the Traderji.com - Discussion forum for Stocks Commodities & Forex. You are currently viewing our boards as a guest which gives you limited access to view most discussions and access our other features. By joining our free community you will have access to post topics, communicate privately with other members (PM), respond to polls, upload content and access many other special features. Registration is fast, simple and absolutely free so please, join our community today! If you have any problems with the registration process or your account login, please read the FAQ. |
![]() |
|
|
Thread Tools |
| Sponsored Links |
|
#1
|
|||
|
|||
|
I experiment a lot on Excel and one of my favorites is to study the price volume relationship in a different way than conventional charts.
Volume is overlayed right on the price and I think this method 'connects' volume to price in a better way, than conventional charts, where volume is overlayed below the price and we tend to take it for granted! 
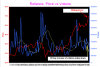
Attached chart shows Reliance vs volume for the period Jan 2, 2007 to May 18, 2007. Notable features are the rising volumes and falling prices in the earlier part of the chart, rising volumes and rising prices in the middle part, and rising prices and falling volumes in the extreme right edge of the chart. Compare this with a conventional chart and see the difference. Colors: Red=Price, Blue=Volume, Yellow=10 day average of volume. ss |
|
#2
|
|||
|
|||
|
Hi SS,
how are you! well, i observe three volume climaxes. The middle one is very important than the other two and hence the trend changed after the middle volume climax. I leave it upto you to think why middle volume climax is important since it is easily observable! am i right? correct me buddy if am wrong, Regards, Winston |
|
#3
|
|||
|
|||
|
Hello Friends
Here is something on P V relationship Regards Niranjanam |
|
#4
|
|||
|
|||
|
Hi
Spydertrader's Jack Hershey Equities Journal at Elite trader will be helpful to you I suppose Niranjanam |
|
#5
|
|||
|
|||
|
Quote:
In the case of RIL, the middle climax volume that Winstonn refers too would be the Peak volume (in downtrend) according to Hershey's method (although his method seems to be a long-only one) Nothing very novel about the method though - just a better packaged version of the usual 'buy-on-pullback-sell-on-climax' method. Not even bidirectional. Even the quantification of the DU volume (& therefore the FRV & PV) is subjective. Regards, Kalyan. |
|
#6
|
|||
|
|||
|
Here is a variation. Yesterdays price is substracted from todays price and the result is multiplied by todays volume.
Chart is for HLL. from Jan 2, 2007 to May 18, 2007. ss |
|
#7
|
|||
|
|||
|
Quote:
Regards, Kalyan. |
|
#8
|
|||
|
|||
|
Quote:
Thanks Kalyan, ss ![]() |
|
#9
|
|||
|
|||
|
thank u. I will look into it.
|
|
#10
|
|||
|
|||
|
Wow what does a cool snake looks like ,wearing a designer glass ?
|
| Sponsored Links |
|
|
![]() |
| Thread Tools | |
|
|
Similar Threads for: Price-Volume Relationship- A Different Perspective.
|
||||
| Thread | Thread Starter | Forum | Replies | Last Post |
| Anatomy of a Trend- Volume by Volume! | sunil saranjame | Technical Analysis | 43 | 23rd February 2007 10:06 PM |
| E Book on Price Volume Action | Niranjanam | Books | 1 | 25th October 2006 02:24 AM |
| Understanding of Brokerage from the perspective of Geojit | ashpin | Brokers & Demat Matters | 2 | 6th April 2006 09:06 PM |
| Gold-Crude Oil relationship | Saint | Metals | 5 | 28th March 2006 04:28 PM |
Indemnity, Disclaimer & Disclosure
Notice:
• By visiting Traderji.com you indicate your acceptance of our Forum
Rules Disclaimer & Disclosure and indemnify Traderji.com, its
associates and related parties of all claims howsoever resulting from
the usage of the forum.
• Disclaimer: Trading or investing in stocks & commodities
is a high risk activity. Any action you choose to take in the markets
is totally your own responsibility. Traderji.com will not be liable for
any, direct or indirect, consequential or incidental damages or loss
arising out of the use of this information.
• Disclosure: The information in this forum is neither an offer
to sell nor solicitation to buy any of the securities mentioned herein.
The writers may or may not be trading in the securities mentioned.
• All names or products mentioned are trademarks or registered trademarks of their respective owners.
General Content Disclaimer Notice:
In light of our policy of encouraging candid, open exchanges of views and the rapid distribution of information originating from many sources, Traderji.com cannot determine the accuracy of information that may be uploaded to the forum. Opinions, advice and all other information expressed by participants in discussions are those of the author. You rely on such information at your own risk. You are urged to seek professional advice for specific, individual situations and not rely solely on advice or opinions given in the discussions. Since Traderji.com is an open and free discussion forum, any comments made by members of this forum in their posts reflect their own views and not of the owner or administrator of Traderji.com. Thus the owner/administrator indemnify themselves of all claims whatsoever and will not be liable or responsible for any members comments/views in this forum Traderji.com. If you find any objectionable or offensive posts made by members of this forum which you would like to bring to our notice for removal then please Contact Us.