simple steps to identifty Wolfe

winstonn

Well-Known Member
#1
Hello friends,

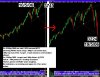
see the USD / CHF daily chart.

have made simple steps to plot wolf:

this is for Bearish setup:

1) three clearly important swing points i.e. 1, 3, 5 must be symmetrical in
time.

2) point 5 must touch 1-3 trendline and then price again goes back below
1-3-5 line.

3) 1-3-5 trendline and 2-4 trendline must converge or move in same direction.
i.e. point 4 must be higher than point 2.

can be applied to bear flags , pennants , wedges BUT Beware to apply it on Expanding triangles.

See the chart.

Regards,
Winston
 
Last edited:

RSI

Well-Known Member
#2
three clearly important swing points i.e. 1, 3, 5 must be symmetrical in
time.


Winston
Hi Winston,
Great post. Just one doubt. I think by saying "symmetrical in time", you are inteding to mean that the number of days between point no. 1 and 3 and number of days between point no. 3 and 5 must be same/equal or at least near to similar/equal. Am I right? Or is it anything else?
Your reply is much appriciated.
Thanks and regards
R. S. Iyer
 

winstonn

Well-Known Member
#6
Hi Sudhir,

You have a bearish setup, right!

but on the 1-3-5 trendline, point 3 is lower than point 1 which is not allowed. for bearish setups, 1-3-5 TT must be sloping upwards with time symmetry.

So what you have plotted is not a wolfe wave. If the trade goes right , it wont be because of wolfe wave.

Happy Trading,
Winston
 

winstonn

Well-Known Member
#8
Hi Azax,

saw your charts!!!!! you are among the few 'Ratnas ' to call the May crash. Keep it up. I think no other mechanical method and indicator would have been able to do so.

I also firmly beleive that if rules are followed and patience is preserved, Wolfe waves can out perform most other methods. It is Highly objective as opposed to subjective elliott waves.

One thing about Ww's, i learnt free from net, but the original site demands about $3000 for entire detailed course.

Happy Trading,
Winston
 

winstonn

Well-Known Member
#9
Hi friends,

i am posting two charts of same daily data for Rcom.

chart one is how all bearish rules were followed and bearish target was achieved.

another chart shows that if rules are not obyed, how can a chart fail and wolfe wave is blammed. In this chart there are three wrong things:

1) point 5 did not touch 1-3 trendline
2) 1-3 TT and 2-4 are diverging instead of converging.
3) There is no symmetry between points 1-3-5.

This chart is for learning purpose.

Happy Trading,
Winston
 
Last edited:

winstonn

Well-Known Member
#10
Hello,

in future , RCom may drop also,( and if it does drop ,than dont think it was because of wolfe waves) but the second chart was shown so that wolfe waves are not wrongly identified.
 

Similar threads