D
DEAR FRIENDS ,..
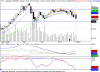
This stock was in my watch list since past so many days...
I think worst is not over yet with this stock.
A double top has been formed ,.. On friday it has given the Pattern Confirmation breaching the support line...
Now , target for this stock ( future ) is 156 .. still 10 rs more????
And dont forget its a Heavy Weight .....
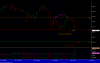
Hind Lever is also not so strong...
Experts comments please...
Regards,..
Darsh
This stock was in my watch list since past so many days...
I think worst is not over yet with this stock.
A double top has been formed ,.. On friday it has given the Pattern Confirmation breaching the support line...
Now , target for this stock ( future ) is 156 .. still 10 rs more????
And dont forget its a Heavy Weight .....
Hind Lever is also not so strong...
Experts comments please...
Regards,..
Darsh
Attachments
-
 12.1 KB Views: 103