@ Sai Venkat..
The "Modified Swing Charts" are basically an improvisation of Gann Swing Charts. A Gann Swing Chart is typically constructed by connecting the "Significant" Highs & Lows. Togather with this, the principles of Dow theory are also applied to define the current Trend and Counter Trend(or Correction).
A little peep into Dow theory..
As we all know, Dow theory says, in case of an UP Trend, there should be Higher Highs & Higher Lows; similarly a DOWN trend is said to be intact as long as we are getting Lower Lows & Lower Highs. A change in Trend from lets say, UP to DOWN is considered whenever there is a breach of the previous "Significant" Low.
Now, here lies the catch.. !! How do you define if a low(or high in case of DN trend) is "significant" or not..??
Though it might not look that difficult on retrospective, but the problem with this theory is that it is actually very difficult to figure out if a particular Low was significant enough and the beach of which would mean a Reversal or not..!!
Here comes the improvisation on the Gann Swing Charts...
The Modified Swing Chart helps you to figure out the significant Low/High which signifies the trend change point.
In this technique, the price action is considered to be either in a Trend mode OR in a Counter Trend mode(Corrective mode/a Correction). Now, we don't try to trade against the Trend; rather we wait for the formation of the "significant" low/high, which is known as the Swing Low or Swing High and thus the counter trend/correction to get over.
For the counter trend OR the correction, we look for a minimum of 3 **Counter Trend Days(this can be complex at times like, there can be more than 3 days, and it may not be consecutive) . Now, once we have fulfilled this 3 day criteria, the Swing Chart is set and now we are looking for a move in the direction of the main trend. A fresh Trend Continuation signal is given whenever there is a breach of the previous day's high (in case of UP trend) and the Swing Low formed marks the "Significant Low".
A change in trend will be considerred whenever the previous Swing Low/High is breached.
The BUY/SELL Signals may be filterred with 38 EMA & 5 RSI (with 20-80 bands).
The TGTs are decided on a different logic.
** The Criteria for counting the counter trend days are little ticky..I am holding them back as of now..!!
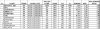
Example on NIFTY's recent price action..
NIFTY made its last (UP)Trend high of 6042 on 7th Jan and then it got into a Counter trend mode(Correction) which lasted for 4 trading days making a Swing Low of 5940 on 11th Jan.
A fresh Trend Continuation Signal ( BUY Signal) was given on 14th Jan above the High of 11th Jan of 6019. The Swing Low of 5940 is considerred to be the point where the correction was over and therefore, the same is kept as Stoploss for this Signal.
P.S: Refer my post dated 14th Jan.
For any further clarification please reply on this post or you can reach me (Prasenjit Biswas) @ (0)98366 23332.


 Modified Strategy to earn 15%-20% a month (Strategy inspired by Linkon7's strategy)