


I can help you with stock chart reading
- Thread starter vvonteru
- Start date
- Status
- Not open for further replies.
Re: Mr Vvonteru
I would not do that. Did you see my BSE500 chart? Until the arrow points up, I am not buying. Even if I want to buy, my methodology requires either MACD divergence (I don't trust this in all cases) and/or stock being above 50 day EMA. If there are not, I don't know what to do with the stocks. Leave alone telling U what to do.
U should be posing this question to Long Term Investors. My take on this rally is, it is just a correction. Use this correction to take out partial/full loses. Do not buy stocks. Give it couple of days. It will start coming down soon. But, I wish I am wrong.
kumar7 said:
Can I start accumulating Adlabs, Hindustan Zinc, Bajaj Hidustan, Mahendra Gesco!
I know all the charts are smashed, but I want to buy for medium term!
Can you please take a look at the above stocks.
I know all the charts are smashed, but I want to buy for medium term!
Can you please take a look at the above stocks.
U should be posing this question to Long Term Investors. My take on this rally is, it is just a correction. Use this correction to take out partial/full loses. Do not buy stocks. Give it couple of days. It will start coming down soon. But, I wish I am wrong.
Re: Mr Vvonteru
Thanks for your comments!
Kumar
vvonteru said:
I would not do that. Did you see my BSE500 chart? Until the arrow points up, I am not buying. Even if I want to buy, my methodology requires either MACD divergence (I don't trust this in all cases) and/or stock being above 50 day EMA. If there are not, I don't know what to do with the stocks. Leave alone telling U what to do.
U should be posing this question to Long Term Investors. My take on this rally is, it is just a correction. Use this correction to take out partial/full loses. Do not buy stocks. Give it couple of days. It will start coming down soon. But, I wish I am wrong.
U should be posing this question to Long Term Investors. My take on this rally is, it is just a correction. Use this correction to take out partial/full loses. Do not buy stocks. Give it couple of days. It will start coming down soon. But, I wish I am wrong.
Kumar
Hi vv,
Very informative and educative comments(spl. the begining ones) I have copied and saved it on my desktop. yes, as you said we spend a lot of money and time on our Bachelors, PGs, training, ojt etc., but I failed to think in the same way about the trading too. But,now I have decidied to consider this as an educative phase and promised myself to earn back whatever I have lost in the market. Sincearly, I did not knew that people use so much TA, chart analysis etc., I... did not beleived that all these will work. Thanks vvonteru, Best of luck for you,
usha
SOUMITRA DEODHAR said:
Hello,
Should I Buy Arvind Mills At These Levels
Should I Buy Arvind Mills At These Levels
http://charting.bseindia.com/charting/index.asp
Just an experiment to all those who want to buy now. Throw up a knife. While the knife is falling down, try to pick it. Let me know the result. Just kidding. Don't do it. At least answer to yourself, what is the probability that U will injure yourself versus catching safely? Didn't I say in the beginning of my thread, 'Trading in stock market is Common Sense'.
Last edited:
usha said:
Hi vv,
Very informative and educative comments(spl. the begining ones) I have copied and saved it on my desktop. yes, as you said we spend a lot of money and time on our Bachelors, PGs, training, ojt etc., but I failed to think in the same way about the trading too. But,now I have decidied to consider this as an educative phase and promised myself to earn back whatever I have lost in the market. Sincearly, I did not knew that people use so much TA, chart analysis etc., I... did not beleived that all these will work. Thanks vvonteru, Best of luck for you,
usha
Very informative and educative comments(spl. the begining ones) I have copied and saved it on my desktop. yes, as you said we spend a lot of money and time on our Bachelors, PGs, training, ojt etc., but I failed to think in the same way about the trading too. But,now I have decidied to consider this as an educative phase and promised myself to earn back whatever I have lost in the market. Sincearly, I did not knew that people use so much TA, chart analysis etc., I... did not beleived that all these will work. Thanks vvonteru, Best of luck for you,
usha
1. Entries and Exits by Elder (this sucks)
2. Trade your way to financial freedom by Van Tharp (so far ok. just started)
This note is directed to short to intermediate traders. But, long term investors, U should read too.
Most of U have a question in your mind. If I don't buy now, when do I buy. Will I miss the move. Some stock XYZ was 150 a couple of weeks back and now it is 50. It is so cheap. So, why can't I buy it. I have couple of examples explaining why not and indicator(s) when U should.
Before I delve into the (real) examples, I just want to make a statement. Any thing can happen in the market. All options are open. They just have different probabilities.
Examples (from US market):
1. This example is from US 2000 bull market. Nasdaq was around 5000. It dropped to 3500. People thought all the stocks were cheap. So, bought more. Then it dropped further. People thought, the market was doing similar things as before. It drops and comes back. Till date, it never did. Nasdaq is around 2000 now.
2. During that bull market period, people bought a stock JDSU for $160. Now it is $3.00. After so much selling, JDSU was known more for Just Don't Sell Us. Here is the link if U want to check out the stock. Like JDSU, there are several US stocks that are no where the price near 2000 year.
http://bigcharts.marketwatch.com/in...ddate=&show=true&symb=jdsu&draw.x=59&draw.y=9
3. Here is a mutual fund from the bull market era. Was around 100 during that time. Now under 20.
http://bigcharts.marketwatch.com/in...date=&show=true&symb=prscx&draw.x=59&draw.y=9
4. How about Japanese market. What a slump. Just recently, it started picking up.
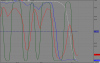
I can give U more examples. But, I guess U guys got the point. Now the question is, when is the right time to enter. Just as doctors use stethoscope to check heart beat of a sick patient, we have EMAs to check our falling markets (Its a patient now). So, lets see how the market (BSE500 or Sensex or Nifty) is doing using 8 (short), 50 (intermediate) and 200 (long term) day EMAs.
1. Below 8 day EMA. Bearish for short term
2. Below 50 day EMA. Bearish for Intermediate term.
3. Below 200 day EMA. Bearish for Long term.
4. 8 day EMA crossed down 50 day EMA. I use this for shorting.
5. 8 day EMA has not crossed down 200 day EMA. So, there is still hope for the market.
6. 50 day EMA has not crossed down 200 day EMA. This comes after step 5. This is the worst case. At this point 200 day EMA is sitting above 8 and 50. We don't want this to happen.
From the above, if you scale from -5 (bearish) to 0 to 5 (bullish), the market is around -3. So, what do we want to see if the market has to become better.
1. Market must come above 200 EMA.
2. 8 day EMA must cross above 50 day EMA.
Let the above 2 happen. Then, I will put tons of stocks for U to buy. Until, then keep the powder dry. Have the cash.
Common Sense Note: Don't feed a sick patient who has lost weight. Let the patient recover from sickness. Then we feed.
For all the people who are investing for long term. Don't think long term means, buying and holding. Long term means, buying and doing home work at each and every step. Home work on the stocks fundamentals. Did the fundamentals change? Did the fundamentals change in the market conditions. Did U consider interest rates that are rising globally? U have to consider not only stocks fundamentals but also underlying economic conditions.
Most of U have a question in your mind. If I don't buy now, when do I buy. Will I miss the move. Some stock XYZ was 150 a couple of weeks back and now it is 50. It is so cheap. So, why can't I buy it. I have couple of examples explaining why not and indicator(s) when U should.
Before I delve into the (real) examples, I just want to make a statement. Any thing can happen in the market. All options are open. They just have different probabilities.
Examples (from US market):
1. This example is from US 2000 bull market. Nasdaq was around 5000. It dropped to 3500. People thought all the stocks were cheap. So, bought more. Then it dropped further. People thought, the market was doing similar things as before. It drops and comes back. Till date, it never did. Nasdaq is around 2000 now.
2. During that bull market period, people bought a stock JDSU for $160. Now it is $3.00. After so much selling, JDSU was known more for Just Don't Sell Us. Here is the link if U want to check out the stock. Like JDSU, there are several US stocks that are no where the price near 2000 year.
http://bigcharts.marketwatch.com/in...ddate=&show=true&symb=jdsu&draw.x=59&draw.y=9
3. Here is a mutual fund from the bull market era. Was around 100 during that time. Now under 20.
http://bigcharts.marketwatch.com/in...date=&show=true&symb=prscx&draw.x=59&draw.y=9
4. How about Japanese market. What a slump. Just recently, it started picking up.
I can give U more examples. But, I guess U guys got the point. Now the question is, when is the right time to enter. Just as doctors use stethoscope to check heart beat of a sick patient, we have EMAs to check our falling markets (Its a patient now). So, lets see how the market (BSE500 or Sensex or Nifty) is doing using 8 (short), 50 (intermediate) and 200 (long term) day EMAs.
1. Below 8 day EMA. Bearish for short term
2. Below 50 day EMA. Bearish for Intermediate term.
3. Below 200 day EMA. Bearish for Long term.
4. 8 day EMA crossed down 50 day EMA. I use this for shorting.
5. 8 day EMA has not crossed down 200 day EMA. So, there is still hope for the market.
6. 50 day EMA has not crossed down 200 day EMA. This comes after step 5. This is the worst case. At this point 200 day EMA is sitting above 8 and 50. We don't want this to happen.
From the above, if you scale from -5 (bearish) to 0 to 5 (bullish), the market is around -3. So, what do we want to see if the market has to become better.
1. Market must come above 200 EMA.
2. 8 day EMA must cross above 50 day EMA.
Let the above 2 happen. Then, I will put tons of stocks for U to buy. Until, then keep the powder dry. Have the cash.
Common Sense Note: Don't feed a sick patient who has lost weight. Let the patient recover from sickness. Then we feed.
For all the people who are investing for long term. Don't think long term means, buying and holding. Long term means, buying and doing home work at each and every step. Home work on the stocks fundamentals. Did the fundamentals change? Did the fundamentals change in the market conditions. Did U consider interest rates that are rising globally? U have to consider not only stocks fundamentals but also underlying economic conditions.
Last edited:
- Status
- Not open for further replies.
| Thread starter | Similar threads | Forum | Replies | Date |
|---|---|---|---|---|
| A | Please help me convert this indicator to metastock | MetaStock | 0 | |
| G | Need help to unlock Metastock exploration formula | MetaStock | 0 | |
| R | [pls help] technical chart for bse stocks | Technical Analysis | 8 | |
| V | Help each other..post u r stocks along with charts.. | Technical Analysis | 270 | |
| M | Help for aptistock and fcharts | Software | 6 |
Similar threads
-
-
-
-
Help each other..post u r stocks along with charts..
- Started by vsangeeth
- Replies: 270
-