


I am glad, that the effect of hammer was lasted yesterday with NIFTY surging more than 100 points by finally engulfing 2nd February candle.
Thanks to Oguru for opening our eyes to profitable trades in just 2 days time.
Today we had a downturn but the closure was somewhat near to what was in FEB-02. This would create a Bearish sentiment in our mind but it is not the case as it seems.
This type of pattern is known as STICK SANDWICH Candlestick. Here is a brief on it below. For sake of visual interpretation the candles are referred as black and white. But in real sense it's up to individuals to configure their charting interface. So in literal sense BLACK=RED and WHITE=GREEN.
Here is the description :-
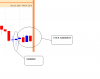
The Stick Sandwich as in (image attached) looks somewhat like an ice cream sandwich. It consists of two dark candles with a white candle in between. The closing prices of the two black candles are equal/nearby. This demonstrates an obvious support price. The probability of a reversal in the trend is high from this area.
Here is the Criteria :-
a) A downtrend is concluded with a large black candle followed by a white candle. The white candle opens above the black candle close and closes above the black candles open.
b) The final day completely engulfs the white candle and closes at the same level as the previous black candle.
What Pattern says in Psychological fashion?
The bears have been in control for awhile. At the end of the downtrend, the last black candle is followed by a large white candle. The white candle opens higher than the close of the last black candle. It trades up for the rest of the day, closing above where the previous day opened. This action makes apparent to the bears that the downtrend may be coming to an end. The next day opens higher but trades down for the rest of the day. It cannot close lower than the previous low close of two days prior. The shorts take notice and start covering upon any buying strength over the next couple of days.
We may need a confirmation for Sandwich pattern to work but most likely it's evident that bulls are now in control of market and a immediate reversal from current trend is resultant.
We can also take last two candles and consider it as Opening Maribozu. As per general market theory, closing Maribozu is a much stronger than opening Maribozu. But I would like to define them to let the smart traders know.
Closing Marubozu
The Closing Marubozu has no shadow at its closing end. A white body does not have a shadow at the top. A black body does not have a shadow at the bottom. In both cases, these are strong signals corresponding to the direction that they each represent.
Opening Marubozu
The Opening Marubozu has no shadows extending from the open price end of the body. A white body would not have a shadow at the bottom end; the black candle would not have a shadow at its top end.Though these are strong signals, there are not as strong as the Closing Marubozu
Wishing a happy trading ahead.
-Vinnie.
Thanks to Oguru for opening our eyes to profitable trades in just 2 days time.
Today we had a downturn but the closure was somewhat near to what was in FEB-02. This would create a Bearish sentiment in our mind but it is not the case as it seems.
This type of pattern is known as STICK SANDWICH Candlestick. Here is a brief on it below. For sake of visual interpretation the candles are referred as black and white. But in real sense it's up to individuals to configure their charting interface. So in literal sense BLACK=RED and WHITE=GREEN.
Here is the description :-
The Stick Sandwich as in (image attached) looks somewhat like an ice cream sandwich. It consists of two dark candles with a white candle in between. The closing prices of the two black candles are equal/nearby. This demonstrates an obvious support price. The probability of a reversal in the trend is high from this area.
Here is the Criteria :-
a) A downtrend is concluded with a large black candle followed by a white candle. The white candle opens above the black candle close and closes above the black candles open.
b) The final day completely engulfs the white candle and closes at the same level as the previous black candle.
What Pattern says in Psychological fashion?
The bears have been in control for awhile. At the end of the downtrend, the last black candle is followed by a large white candle. The white candle opens higher than the close of the last black candle. It trades up for the rest of the day, closing above where the previous day opened. This action makes apparent to the bears that the downtrend may be coming to an end. The next day opens higher but trades down for the rest of the day. It cannot close lower than the previous low close of two days prior. The shorts take notice and start covering upon any buying strength over the next couple of days.
We may need a confirmation for Sandwich pattern to work but most likely it's evident that bulls are now in control of market and a immediate reversal from current trend is resultant.
We can also take last two candles and consider it as Opening Maribozu. As per general market theory, closing Maribozu is a much stronger than opening Maribozu. But I would like to define them to let the smart traders know.
Closing Marubozu
The Closing Marubozu has no shadow at its closing end. A white body does not have a shadow at the top. A black body does not have a shadow at the bottom. In both cases, these are strong signals corresponding to the direction that they each represent.
Opening Marubozu
The Opening Marubozu has no shadows extending from the open price end of the body. A white body would not have a shadow at the bottom end; the black candle would not have a shadow at its top end.Though these are strong signals, there are not as strong as the Closing Marubozu
Wishing a happy trading ahead.
-Vinnie.
Attachments
-
 9 KB Views: 136

 Todays chart is realy disappointing.:It is gapdn and closed near low(Will it safe to go long right nowDo we have 2 close exisiting long?: