New to forum - Advice needed for my SIP

#1
Hi All,

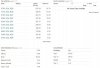
Here is my current SIP portfolio

ICICI Bluechip - 20K/month
Franklin smaller cos - 7K/month
HDFC balanced- 8K/month
HDFC Equity - 5K/month

I am going to stop HDFC equity SIP and add additional 10K of SIP. So in total i have 15K to invest/month.

Questions

1) Which funds should i choose to invest those 15K.
2) Should i redeem my HDFC equity units or should i hold it?
3) I have got units in HDFC Top 200, HDFC Tax saver and DSP BR small & mid cap. I already stopped SIPs in these funds some time back. But i still hold the units. Should i redeem those units?
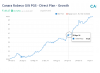
 
#2
I would suggest

you have 15k, so make your portfolio more diversified and buy one ETF, Bond and Debt fund.
ETF: Kotak Nifty ETF - Rs 5000 SIP
Bond: UTI Dynamic Bond - Rs 5000 SIP
Debt fund: SBI Magnum Gilt - Long Term Plan - Direct (G)

Secondly, I would suggest hold all 4 funds Units until you really need money for something.
 

msa5678

Well-Known Member
#3
Why GILT funds are not giving good returns since the past 3 months. Comparing at their yearly returns of 11% per annum, hardly moved around 1% in the past 3 months. What are the factors affecting their growth?

Sent from my SM-G610F using Tapatalk
 
#4
Because GILT funds do not invest in Equity. GILT funds invest in Govt. Securities and that too AAA rated. When these securities will mature you will see movement in the fund.

Below is the typical GILT fund holdings. You can see where they have invested money. When these securities will get mature (latest is 2023), you will see movements. You can also see its Asset allocation%. I hope this will clear your doubt.


Attachments

msa5678

Well-Known Member
#5
Because GILT funds do not invest in Equity. GILT funds invest in Govt. Securities and that too AAA rated. When these securities will mature you will see movement in the fund.

Below is the typical GILT fund holdings. You can see where they have invested money. When these securities will get mature (latest is 2023), you will see movements. You can also see its Asset allocation%. I hope this will clear your doubt.

Pls see the attached graph, I have circled an area, Pls note that there are certain periods, where the GILT funds stay dormant, no increase no decrease, then they start rallying, I wanted to know what are those factors that are triggering these rallies, I have checked, they are not related to equities. And these rallies are almost similar to all the GILT funds.
 

Attachments

#6
By seeing the whole five year chart I can explain you what is happening in the chart.

So lets go back to September 2013 where you see a dip in the chart, it is because, on that month Interest rate has been increased from 7.25 to 7.5%. So whenever Interest rate will increase your GILT fund price will go down and you can clearly see in the chart. You can see it further dips in the chart as Interest rate changed from 7.5 to 8% in Jan 2014.

Now here is the twist :). Elections happened and BJP comes in the Center. Since then Interest rates has been decreased and that's the reason this chart is moving up and up again.

So at your circled point which is Apr 2016, again Interest rate has been revised from 6.75 to 6.5% and that trigger the upward in the chart.

I hope this explanation resolved your query.

If you have more questions, please create new thread.
 

msa5678

Well-Known Member
#7
By seeing the whole five year chart I can explain you what is happening in the chart.

So lets go back to September 2013 where you see a dip in the chart, it is because, on that month Interest rate has been increased from 7.25 to 7.5%. So whenever Interest rate will increase your GILT fund price will go down and you can clearly see in the chart. You can see it further dips in the chart as Interest rate changed from 7.5 to 8% in Jan 2014.

Now here is the twist :). Elections happened and BJP comes in the Center. Since then Interest rates has been decreased and that's the reason this chart is moving up and up again.

So at your circled point which is Apr 2016, again Interest rate has been revised from 6.75 to 6.5% and that trigger the upward in the chart.

I hope this explanation resolved your query.

If you have more questions, please create new thread.
I have opened a thread for further discussion, Please step in ....
http://www.traderji.com/community/index.php?threads/105358/

Sent from my SM-G610F using Tapatalk
 

Similar threads