


From my website at: http://trendmagic.mysmp.com/
On Thursday update, we suggested that the $XAU was going to break down through its support at 132 due to velocity of the decline from Wednesday. We were pushing into 132 with strong price deterioration and volume. We suggested that our PNF counts, trendline support and box range targets all pointed to a pullback into the 130 to 130.5 area. On Friday, this index gapped down and eventually found support at the 130.86 level, marginally above our targets. Upon setting that low, the $XAU rallied and closed nearly 2% off those lows.
This is setting up an interesting scenario. If we get strong price action on Monday, meaning a close above 136, we believe that the pullback is over and that the $XAU will go right back to the resistance area at 141. A close above 136 would suggest that the $XAU created a candlestick formation known as a morning star. We have noted the importance of this in the past as it got us long in VLO. The same sort of bullish implications would apply here if it happens.
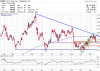
If 130 does not hold on a closing basis, our next logical objective would be in the 125 area which represents an open gap from mid-October and also represents the second half of an island bottom formation. We do not believe that this level will be taken out on a closing basis. To be frank, we do not believe 130 will be taken out on a closing basis. This area should provide strong support as you can see on our chart below. It also represents a 50% retracement of the move from the October lows to the most recent highs at 142.50.
Many analysts are calling for a move down to the 112 to 115 area on the $XAU. Remember, we brought these areas up in the past as major support areas. This level represents a triple top formation that was busted to the upside back in November 2005 and kicked off the move up to the May 2006 highs at 170. Major breakout areas act as magnets on the way back and markets tend to test these levels before they embark on any substantial move higher. Well, we believe that the October lows at 117 fulfills that expectation. Taking a closer look at our chart below, you can see that the $XAU has already put in a triple bottom at the 122 level. The second and third bottoms of that triple bottom formation are in the form of island bottoms. These are extremely bullish candlestick formation and are even more powerful when they present themselves at previous support areas.
The move of the 3rd bottom (or October 2006) was also different in nature. This market consolidated for a few months before moving higher. We built "cause" to attack the 142 area. We believe that the reaction at 142 was expected as it was a major resistance area as you can see by the BLUE down sloping line in the graph below. There is a base in place here and we do not see it being invalidated.
However, we have to be open to anything and this market is as volatile as they come. Keep your stops in place at all times and be ready to adjust accordingly.
On Thursday update, we suggested that the $XAU was going to break down through its support at 132 due to velocity of the decline from Wednesday. We were pushing into 132 with strong price deterioration and volume. We suggested that our PNF counts, trendline support and box range targets all pointed to a pullback into the 130 to 130.5 area. On Friday, this index gapped down and eventually found support at the 130.86 level, marginally above our targets. Upon setting that low, the $XAU rallied and closed nearly 2% off those lows.
This is setting up an interesting scenario. If we get strong price action on Monday, meaning a close above 136, we believe that the pullback is over and that the $XAU will go right back to the resistance area at 141. A close above 136 would suggest that the $XAU created a candlestick formation known as a morning star. We have noted the importance of this in the past as it got us long in VLO. The same sort of bullish implications would apply here if it happens.
If 130 does not hold on a closing basis, our next logical objective would be in the 125 area which represents an open gap from mid-October and also represents the second half of an island bottom formation. We do not believe that this level will be taken out on a closing basis. To be frank, we do not believe 130 will be taken out on a closing basis. This area should provide strong support as you can see on our chart below. It also represents a 50% retracement of the move from the October lows to the most recent highs at 142.50.
Many analysts are calling for a move down to the 112 to 115 area on the $XAU. Remember, we brought these areas up in the past as major support areas. This level represents a triple top formation that was busted to the upside back in November 2005 and kicked off the move up to the May 2006 highs at 170. Major breakout areas act as magnets on the way back and markets tend to test these levels before they embark on any substantial move higher. Well, we believe that the October lows at 117 fulfills that expectation. Taking a closer look at our chart below, you can see that the $XAU has already put in a triple bottom at the 122 level. The second and third bottoms of that triple bottom formation are in the form of island bottoms. These are extremely bullish candlestick formation and are even more powerful when they present themselves at previous support areas.
The move of the 3rd bottom (or October 2006) was also different in nature. This market consolidated for a few months before moving higher. We built "cause" to attack the 142 area. We believe that the reaction at 142 was expected as it was a major resistance area as you can see by the BLUE down sloping line in the graph below. There is a base in place here and we do not see it being invalidated.
However, we have to be open to anything and this market is as volatile as they come. Keep your stops in place at all times and be ready to adjust accordingly.
Attachments
-
 31.8 KB Views: 13