Want help to write program in afl (amibroker) to setup buy call- logic as follows

#1
Set chart as 1 min candle stick
Logic starts when market is in sell mode
Analyse market to sell mode by EMA 20 - 50 down
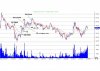
for the same example chart.jpg is enclosed for the reference with the variables marked on it

-Logic starts only when market hit bottom of the day
- record the highest price above EMA20-EMA50 - store it in variable - r1 (7984)
- price comes down record lowest price store it in variable - r2 (7975)
if r2 >= EMA 20 & EMA 50 then - EMA20 IS 7974.18 EMA50 7973.48
continue
else
exit from the logic

- program exit mode - if price goes below r2 exit from logic

- continue
- price goes above r1 record highest price in variable - r3 (8003.43)
- price comes down record the lowest price - r4 (7985.35)
if r4 < r2 then
exit from the logic
else
- continue
- after this 1st white candle comes record highest point - r5 (7988.7)
- buy above r5 trigger price (r5+0.5) trade price (r5+0.5+1)
- set stop loss as r4
- set exit price as (r5+0.5+1+12)
 

Attachments

Last edited:
#3
Hi
I am in market for last 10-12 yrs.
I had work on many strategies only for intrday purpose.
After that i have fixed 4 strategies to buy & 2 for sell.
Market works on human psychology, it always test your limis. Many of you had experience that after your stop loss triggered market moves in the same trend i.e. it makes you to think that your exit was wrong.

If in case after hitting sl if you don't exit. It increases your losses.makes you to think you must exit at your stop loss.

So its confused condition whether to exit @ stop loss or not.

Also at the time of exit in profit market makes you to exit early, if you exit it moves in same trend heavily, if you try to carry your position it will cost you to reduce your gained profit or may incurred loss.

To overcome this doubts I have some strategies. Those are working very nicely.

One of the buy strategy I have mentioned earlier.

Please help me to convert into program to work in amibroker afl language.
 
#5
Hi

The MA part is clear but the high/low points are relative. Can you clearly define your R1/R2 etc . . . in programmable terms like HH / LL value for how many bars etc also how do you define your R1/R2 in terms of how many bars you will wait to declare a Swing high/low is in place . . .

Thanks
Happy :)
 
#6
Hi,
First thank you very much for the reply

For creating R1
- Graph plotted of candle stick of 1 min.
- This program should starts when both EMA 20 & EMA 50 are plotted
- When market lowest value of the day strategy starts
- It should break EMA 2050 with minimum 2 candles (i.e. minimum 2 minutes candles)
- R1 is plotted
- When market starts moving down (i.e. minimum 1 minute black candle (down) comes)
If it is more than 2 candles, it is ok. It should not cross the EMA 2050.
- R2 is plotted
- Market moves up it should cross R1. Minimum 1 candles above R1 of Maximum 4 candles above R1 value
- R3 is plotted
- Market moves down it should not cross EMA 2050 & R2 value. If it crosses the limit exit from the logic
- For the same I don't know the number of candles it will consume
- R4 above 2050 is plotted
- First white candle comes after R4 plotted. Mark the highest value of the same minute.
- R5 is plotted
- At 2nd candle our buy is initiated
- Buy above r5 trigger price (r5+0.5) trade price (r5+0.5+1)
- set stop loss as r4
- set exit price as (r5+0.5+1+12)
 
#7
Hi,
First thank you very much for the reply

For creating R1
- Graph plotted of candle stick of 1 min.
- This program should starts when both EMA 20 & EMA 50 are plotted
- When market lowest value of the day strategy starts
Human mind easily finds it i.e. lowest value of the day but do a more clear/precise defining of LoD during intra day hours for coding.

- It should break EMA 2050 with minimum 2 candles (i.e. minimum 2 minutes candles)
- R1 is plotted
Define R1

- When market starts moving down (i.e. minimum 1 minute black candle (down) comes)
If it is more than 2 candles, it is ok. It should not cross the EMA 2050.
- R2 is plotted
Define R2
- Market moves up it should cross R1. Minimum 1 candles above R1 of Maximum 4 candles above R1 value
- R3 is plotted
Define R3
- Market moves down it should not cross EMA 2050 & R2 value. If it crosses the limit exit from the logic
- For the same I don't know the number of candles it will consume
- R4 above 2050 is plotted
- First white candle comes after R4 plotted. Mark the highest value of the same minute.
- R5 is plotted
- At 2nd candle our buy is initiated
- Buy above r5 trigger price (r5+0.5) trade price (r5+0.5+1)
- set stop loss as r4
- set exit price as (r5+0.5+1+12)
In short for all of above you need to define the fractals clearly,

BTW many such implementations of PH/PL are already shared here on Traderji

Thanks
Happy :)
 
#8
I am getting the real problem of getting these variable values

I am giving you the logic as per my way of thinking. Please go through it. I may be wrong to judge this situation.

At first I will send first two values of the logic, If it is ok then I will send you the next one.

How to find lowest value (definition of lowest)
- Plot EMA 20 EMA 50, If 2050 is down market is in sell mode
- So at each lowest bottom value (lowest value of shadow) store the value & mark it as lowest value till time
- If got lowest value then only entry in the logic to find R1 to R5 values otherwise do not entry in the logic

How to find R1
- Achived lowest value then only start finding R1 value.
- After each minute find close of the candle is above the EMA 2050 value
- close above 2050 traced mark it as "tr1" (this must be white candle)
- if black candle (gap up) opens & closes above 2050 then exit from the logic
- after this minute next candle must be White candle with close above the "tr1"
mark it as "tr2" (tr2 > tr1)
- If again next candle is white use above do while loop (replace "tr1" "tr2" till we get next candle black)
-mark heighest value of this 2nd candle & store it in R1

Is is ok can you be able to get the variable value with this logic.
 
#9
OK


Lets just focus only on 1 thing a time i.e. getting lowest value

Say NF makes a Low of 7670 at 10:30 AM . . .

Now at 11:00 AM it is 7685 . . .

But at 11:30 AM it may be 7665 (i.e. new Low) or 7700 new high

The question is how do we say a Lowest Value for the day is printed during intraday hours


Thanks
Happy :)
 
#10
For getting lowest value
EMA 20 -50 must be down then only try to find lowest value otherwise not required
As per your above values there is no exponential moving (EMA) reference. It plays imp role
If EMA 2050 is down then 7665 level we hv to mark as new low
In above said logic i hv mentioned when we hv to exit from the logic
 

Similar threads