Hello, this is my first 1 hour T.A chart i would like SG sir to have a look at it and comment if i got somewhere wrong. please don't delete this thread i will delete it as soon as i hear from you about the chart
ALL THE LINES ARE SUPPORT ,RESISTANCE AND FIBO LEVEL eur/usd bounced back high today, i don't know why it should not have happened because the NFP of USA was better than expected, so it should have supported to usd anyways it was very volatile , i think from here it must resume the downtrend !
Hi, thank you sir for your reply, i know the stochastic, it works like RSI above 80 market is overbought below 20 market is oversold, the bollinger bands shows that the market is very volatile and not moving in a peaceful manner, i do not know how does the SMA work because it requires to plot 5 period and divide it by 5 and i am not so good in maths but could you explain how does it work like what is 100 simple moving average, why is there a 100? and 9 also in the yellow line. what does this indicate? and sir for the descending triangle it was for the 4 hour chart that i marked , when i look at the 4 hour chart of eur/usd i see descending triangle? AND also please tell me which time frame should i be focusing on for scalping ? 1 hour or 4 hour? please correct me if i got wrong somewhere !
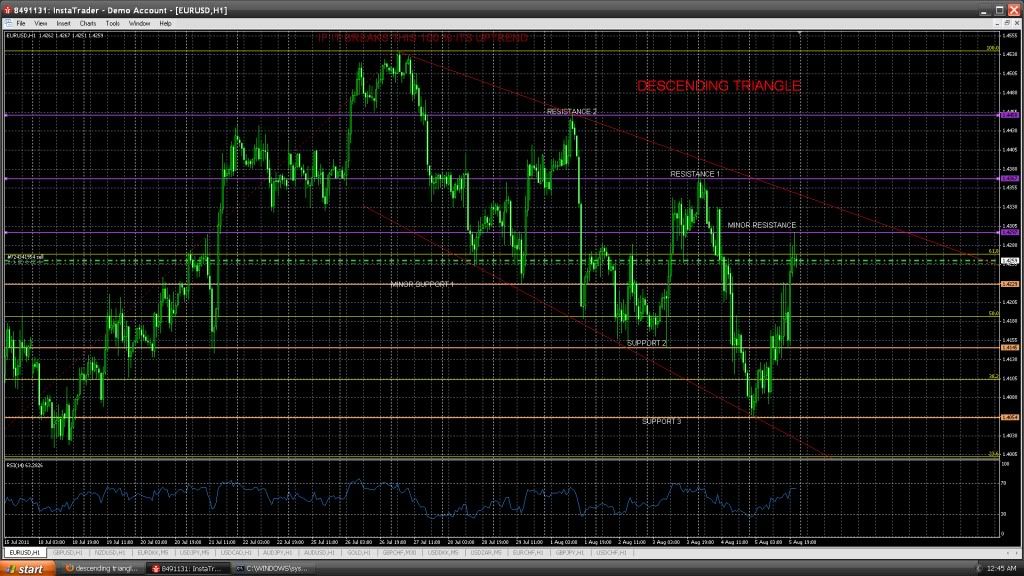
sir i can't spot difference because i think sir your chart is zoomed in a bit and my is zoomed out but sir i see that the fibo you have placed is on the recent high on 1.4350 at 3rd august, i do not know how does SMA work because i am not good in maths could you please explain sir? it would be helpfull for me? and secondly there is a threat in the forum about the punishment of fx in india people are waiting for your kind reply