![]() |
|
| Discuss Useful Tools at the Equities within the Traderji.com - Discussion forum for Stocks Commodities & Forex; Hello Guys, I am a very young trader having started only a year ago.But in ... |
|
|||||||
| Notices |
| Equities Discuss & analyse stock market news, views, trends and your favourite stocks here. |
![]() |
|
|
Thread Tools |
| Sponsored Links |
|
#1
|
|||
|
|||
|
Hello Guys,
I am a very young trader having started only a year ago.But in this course of time have learnt a lot of useful things on market.I use TA to trade.I do so mainly on Options.Equity is not my cup of tea.But i base my system on Cash data. Okay I will share with u a few things that i learnt.One thing at a time. Moving Average I see a lot of ppl using Moving Average,especially the new ones.Its a lagging indicator meaning it follows the trend.I see ppl using 25 day,50 day and 200 day etc.Traditional TA proposes this. What I propose that if possible use Fibonacci series as ur periods ie 3,5,8,13,21,34,55,89,144,233 etc.Use of EMA will be encouraged as well as WMA as these are more relevant. 
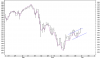
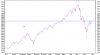
A recent example is the stabilizing of Nifty at 2634 region.(Making a low of 2595).Now 377 day EMA was sitting bang at 2634.I ve seen it work better.Ofcourse its a confirmatory tool for me.Has worked well for me right from the slides. Now it was very heart breaking for me to see the closing of Nifty Fifty,because I regarded Amitji as a Dronacharya for me because even though i had not met him,i had learnt a lot from his postings.It was the first thing for me to do inspite of it being posted near about market opening time. I hope that Amitji wud reconsider his decision in due course of time. A word of caution,I see a double top being formed on the nifty,i dont know what its implication wud be.Perhaps somebody wud post. Regards Amit |
|
#2
|
|||
|
|||
|
Quote:
Can you please attach a chart where we can see the Double Top Formation? Best Regards, --Ashish |
|
#3
|
|||
|
|||
|
Hi Ashishji,
Here is the chart.Of course u will see some discrepancy beacuse I use the neely method of plttin price but nevertheless real high shud be in range of 3124.I will wait for ur comments. Regards. Amit |
|
#4
|
|||
|
|||
|
Quote:
Oops sorry .. have to see yr chart again |
|
#5
|
|||
|
|||
|
Yes now ..
My suggestion is to look for a double top in a chart of a shorter duration ... say 6 months ... and preferably see an OHLC chart If u can't easily retrieve, I will do so ... let me know Now if u still think its a double top in formation, one has to analyse Will revert AGILENT |
|
#6
|
|||
|
|||
|
Here u are :
http://in.finance.*****.com/q/bc?s=%...off&z=l&q=b&c= Does it make it better ? WIll also have to look up theory behind double tops before passing judgment ( I mean , whether such patterns apply to reversals from 'Secondary' rallies ... like the one we are witnessing since mid June ... I had imagined they will belong more appropriately to reversals of 'Primary' trends ) Will have to study more in detail AGILENT |
|
#7
|
|||
|
|||
|
Quote:
As the time period of the suggested pattern is quite small and volume data is not shown on the chart, I would hesitate to call it a double top for other factors are also not matching. However, we rarely see bookish chart patterns in real life and hence if the prices come down from the top level shown by you and cross the valley formed decisively, I would like to go short with SL at the top level. BTW, perhaps the Double Top formation,if there was any, would be negated today if the prices stay at the level they are. Best Regards, --Ashish P.S.: Please, no Ji. Assi to avi vadde chhotte ain. ![]() |
|
#8
|
|||
|
|||
|
Quote:
Regards, --Ashish |
|
#9
|
|||
|
|||
|
I think it maybe so that todays intraday high maybe 3124-3128 and the upside to watch from here wud be 3198.Where a profit taking may set in.
Also note in hindsight how the action is being repeated as was the case in the beginning of last months contract.Will have to give it more thought over the weekend. Perhaps this will make it more clear.(i am attaching the OHLC chart).the purple line is the plot method of Glenn Neely. Now i will share 1 more thing. Please note the breach of trend channel(by the OHLC) on lower side,implies oversold conditions.Vice versa on upper channel.It has given me Regards Amit |
|
#10
|
|||
|
|||
|
I agree with agilent . Double tops normally appear on primary trends and not in intermediate rallys. . Double top are normally top reversal patterns appearing after the market has been trending up for a longer period about six months.
Also please remember only 30% of the double tops really work as reversal patterns. The rest fail. Also Double Tops have to be confirmed by decisively breaking of the neckline. Otherwise they hold no significance as an reversal pattern. Karthik |
| Sponsored Links |
|
|
![]() |
| Bookmarks |
| Thread Tools | |
|
|
Similar Threads for: Useful Tools
|
||||
| Thread | Thread Starter | Forum | Replies | Last Post |
| Options Strategy Analysis Tools | sh50 | Options | 15 | 14th July 2007 01:13 AM |
| METASTOCK EOD -- Data conversion tools | sgrsankar | MetaStock | 5 | 17th March 2006 07:03 PM |
| Analysing Tools | hometypist | Trading Resources | 0 | 18th August 2005 10:41 AM |
| Trader small tools | aree | Software | 0 | 29th July 2005 06:16 PM |
| All Utilities/tools At One Place | sh50 | Your Feedback & Suggestions | 0 | 2nd October 2004 10:13 PM |
Indemnity, Disclaimer & Disclosure
Notice:
• By visiting Traderji.com you indicate your acceptance of our Forum
Rules Disclaimer & Disclosure and indemnify Traderji.com, its
associates and related parties of all claims howsoever resulting from
the usage of the forum.
• Disclaimer: Trading or investing in stocks & commodities
is a high risk activity. Any action you choose to take in the markets
is totally your own responsibility. Traderji.com will not be liable for
any, direct or indirect, consequential or incidental damages or loss arising out of the use of this information.
• Disclosure: The information in this forum is neither an offer to sell nor solicitation to buy any of the securities mentioned herein.
The writers may or may not be trading in the securities mentioned.
• All names or products mentioned are trademarks or registered trademarks of their respective owners.
General Content Disclaimer Notice:
In light of our policy of encouraging candid, open exchanges of views and the rapid distribution of information originating from many sources, Traderji.com cannot determine the accuracy of information that may be uploaded to the forum. Opinions, advice and all other information expressed by participants in discussions are those of the author. You rely on such information at your own risk. You are urged to seek professional advice for specific, individual situations and not rely solely on advice or opinions given in the discussions. Since Traderji.com is an open and free discussion forum, any comments made by members of this forum in their posts reflect their own views and not of the owner or administrator of Traderji.com. Thus the owner/administrator indemnify themselves of all claims whatsoever and will not be liable or responsible for any members comments/views in this forum Traderji.com. If you find any objectionable or offensive posts made by members of this forum which you would like to bring to our notice for removal then please Contact Us.