


JAIPRAKASH ASSOCIATES Weekly NSE Stock Chart Technical Analysis:
Jaiprakash Associates (previously JayPee Cements) rose this week after 2 months of falling.
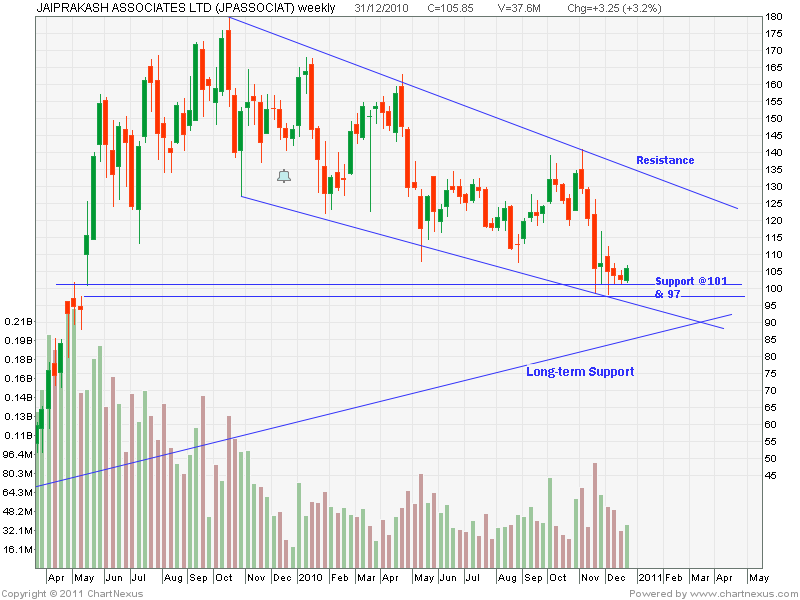
Close & CMP: 105.85
(This is a weekly chart so each bar / candlestick denotes price movement of 1 week)
Sentiment: Bullish
Market Outlook:
- The price seems headed upwards.
- There is an opportunity to buy / go long with a target of 125, stop loss 96.50
- But if NIFTY underperforms, liquidate around 117.
- There is strong support between 97 and 101.
Technical Indicators:
- The price fall slowed down as soon as it hit its support at 101, as visible from the small candlestick bodies.
- The support at 101 seems strong and so the price has started moving up again.
- There is a resistance line around 125, sell when the price reaches near this point.
- The price is deeply undersold, which also indicates that the price is ready for upward movement.