Hello everybody,
Merry X-mass and a happy new year to all of you!
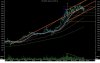
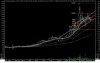
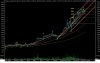
i have attached RIL daily chart. Notice unique three price swing divergence.
This is not a usual divergence, you can say that a wedge is broken down with a MACD divergence.
The three price swings are very close to each other with great volatility.
along with divergence, this presents generally very good opportunity to counter trade on all time frames.
HOWEVER, IT IS NOT ADVISABLE TO ACT ON PURE DIVERGENCE ONLY.
HERE THE SET UP IS COMPLETE AND A SWING LOW OF 2652 WAS FORMED.
IF AND ONLY IF THIS LOW OF 2652 WOULD BE TAKEN OUT THEN, I WOULD GO SHORT WITH THE TARGETS OF 2300 AND WOULD FURTHER OBSERVE FOR 2000 WITH THE STOP OF MOST RECENT SWING HIGH.
Seniors and our experts, please do comment your views.
Take care,
Merry-Xmass
Winston")
Merry X-mass and a happy new year to all of you!
i have attached RIL daily chart. Notice unique three price swing divergence.
This is not a usual divergence, you can say that a wedge is broken down with a MACD divergence.
The three price swings are very close to each other with great volatility.
along with divergence, this presents generally very good opportunity to counter trade on all time frames.
HOWEVER, IT IS NOT ADVISABLE TO ACT ON PURE DIVERGENCE ONLY.
HERE THE SET UP IS COMPLETE AND A SWING LOW OF 2652 WAS FORMED.
IF AND ONLY IF THIS LOW OF 2652 WOULD BE TAKEN OUT THEN, I WOULD GO SHORT WITH THE TARGETS OF 2300 AND WOULD FURTHER OBSERVE FOR 2000 WITH THE STOP OF MOST RECENT SWING HIGH.
Seniors and our experts, please do comment your views.
Take care,
Merry-Xmass
Winston
Last edited: