Dear Friends,
Whats happening in the market ?
Our post sayes some wolfe or somwhat wave funda , I belive you guys as i think you are more experienced.
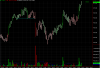
See today market opening in gap.
Its really confusing.
Mind and heart is not matching with synchrosinity.
I think I need to start learning basics practical fundamentals.
Help Help Help
Whats happening in the market ?
Our post sayes some wolfe or somwhat wave funda , I belive you guys as i think you are more experienced.
See today market opening in gap.
Its really confusing.
Mind and heart is not matching with synchrosinity.
I think I need to start learning basics practical fundamentals.
Help Help Help