


Far from doomsday prophets, and psychic soothsayers, I thought it would be a good discussion to ponder on market scenario for the next 2 months. I am an avid speculator on nifty. So I am trying to add my 2 cents on nifty analysis. This is what I understand of the charts.
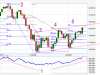
Analysis of [attached] chart...
a. On balance volume on 15th April is nearly same as that on 8th of Feb. (see '1').
b. The trading days between Points 2 to 3, 3 to 4 and 4 to 5 is 15 days (exactly) each. We are still 1 day away for point '5' i.e. April 16th.
c. The support and resistance lines for 3 and 4 identify 3943 as the resistance point on 5 (April 16th again).
PS: the enhanced pivots for 15th April also identify 3943.05 as resistance and 3863.75 as support.
d. For the entire 650+ point fall, the triple top of 3, 4, and 5 will close all open short positions (for sellers from 4245)
Close of Nifty on 16th April is really critical, if it closes above 3943, then this was a good academic exercise, otherwise this will be a great discussion for the next few weeks.
So what's the next on cards...?
First nifty fall from 4245 to 3545 was a 700 point fall and the first recovery was at 50% i.e. 3900. If even the third top of the triple top does not advance markets (as there is still a lot of bear steam left), then we will possibly see another fall on 700 points from 3945 levels. I.e. possibly 3250 levels. That's a 'z' pattern. (this is indicated by a. OBV which has not fallen to mid 2006 levels, and Williams AD is at 1195K(Apr 15) from 6162K(Feb 8))
Contrary view...
May be we will see another advance start on 16th apr and possibly 4650 is on cards next, I think the probability of this is really thin.
Disclaimer:
Derivative investments can take the shirt of your back, please ask neighbours, friends, parents and your corner shop pinwale before jumping in. These are my musings to exchange ideas... Yes I am short on nifty :O)...
Attachments
-
 22.9 KB Views: 65
")