Dear Aca trader,
this seems like an excellent trending stock.I reproduce below,what i had read.May be useful:
Here is the third pattern in our series of low-risk, high
probability of success trading patterns.
Pattern 3: Pullback
- This pattern is only applicable in a strongly trending stock
- At least three consecutive lower highs for buying, buy as
stock trades above most recent high
- At least three consecutive higher lows for selling, sell as
stock trades below most recent low
The first question you should have is "what is a stongly
trending stock"? A very good question indeed. The easiest
way to measure a trending stock is to make sure the stock is
either making higher highs and higher lows (for a buy) or
making lower highs and lower lows (for selling short).
That's as difficult as it needs to be. You should be able
to see a strongly trending stock by just looking at a chart.
Remember, if it's not obvious, then it's probably not trending.
Once you have a strongly trending stock, then looking for
pullbacks becomes a snap. Buy a stock that recently made new
highs AFTER it has had at least three consecutive >>lower<<
highs. Don't just buy it at any price after the lower highs.
Buy only as it trades >>above<< the most recent high.
Trust me when I tell you that being patient will be your key
to successful trading. Make sure a stock proves itself, even
just a little bit, by trading above the previous day's high.
Sure, you miss a little of the possible profit. But, you are
actually giving yourself a better chance of being successful.
With all this talk about buying, let's not forget that just
the opposite applies for selling short.
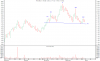
Of course, a picture will show exactly what I am saying in
words much better. So click on the link below to see what
I am talking about.
A Happy New Year,
ranga