hi all friends,
i am starting this thread so that all of us can benefit.
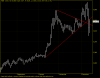
We could include all the stocks developing Symmetrical triangle pattern and breakout before apex for high probable trade.
All of us know that ST triangles are quite relaible!
hope to see all of you posting the stocks have exclusively this pattern.
thanxs
winston
i am starting this thread so that all of us can benefit.
We could include all the stocks developing Symmetrical triangle pattern and breakout before apex for high probable trade.
All of us know that ST triangles are quite relaible!
hope to see all of you posting the stocks have exclusively this pattern.
thanxs
winston
")