


hello
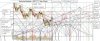
Effect of angular relation of cycles, never you have seen before, It is designed by me ,just you look on nifty movement since Nov 2008 ,there is always major change in direction at 45,60,90 and 120 deg lines. Swing trading at 60 &45 deg line, pulse vibration at outer arc line and rapid down fall at 90 deg vertical line, consolidation phase between two 90 deg horizontal line, Every things can be known well in advance. Believe in the Gann angles, it is pure science and combination of civil and mechanical engineering
Gann Angles, wave theory, retracement or pull back all are based on harmonic motion rule not exactly but more than 99%
MAKE SIMPLE RULE FOR NIFTY
Buy Call
1-O to 45 deg
2-45 to 60 deg
3-60 to 90 deg
Always buy at support line
Sell Call
1-90 deg(top of cycle, horizontal line) to 45 deg(top of inner cycle, Horizontal support line)
2-45 deg ( Horizontal support line) 45 deg angle line
In simple words, stock moves in harmonics motion from -0-45-60-90-deg ,a sign of positive move and from 90 deg to 120,135 and 180,a negative move,
A lot of confusing words in the Gann Books regarding angles lines, that is reason ,most of technical analyst does not prefer to do and second is time consuming for each stock. I have simplified The Gann Angles Tech. and tested for more than 50 stocks of India & USA, found its results is excellent with price and time. I am not expert in technical analysis but learning step by step.
Forecasts:- April end-Down fall between 110 to 120 deg of red wheel or 270 to 300 deg of blue wheel nifty level- 4968(+/- 18 pts), upper band 4988 ,mid band 4968 and lower band 4950
May June :- Upward movement, over the Arc line and 60 deg support line of blue wheel, end of June nifty level 5609(+/- 18 pts) up to 45 deg res. line(Right Arm) of Blue wheel
Note:-Due to limited space, the graph will be deleted after 27th March, I will post chart for swing trading
Regards
r.baiga
Attachments
-
 99.5 KB Views: 492
")