Trading overbought stocks using bollinger bands

#1
Technique is very simple.

(1)you need first a technical analysis software to screen overbought stocks.
(2)Screen stocks with closing price greater than upper bollinger band by atleast 3% and volume atleast 1 lakh
(3)On next day short sell this stocks at price higher than the projected Upper bollinger band.
(4)Keep a strict stop loss of 2%.

See one example in attachment.
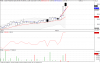
On the date 5/3/2012 close price of stock was 52.25 and UBB was at 49.5.
Now if we project UBB line(RED thick line) as per trend for next trading day UBB value would be around 51.5 rs and that is our base price above which we can short stock.
On next day tinplate open at 51.5 ,high 54.2 and close 49.95.
If we have short at 53.5 then also we would have good profit at the end of day.
 

Attachments

Last edited:

udi1970

NSE FUTURES INTRADAY
#3
Mayur, you really rock. Don't know much about the technical software that you are using to screen such stocks. And also, don't know about the working of bollinger bands and how you drew the trend line using thick red line. I have heard about every thing like technical parameters, system, strategies and did not put anything into a plan practically. So I am practically a zero. You have developed a practical plan and hearty congratulations for that. Please elaborate with more examples and explanations (when you find time ofcourse :) ) for the benefit of losing traders like many of us. Thank you once again. Best wishes
 
Last edited:
#4
Daily we may find around 5 to 6 stock with overbought by bollinger band.
Generally during first half hour of trading, this stocks goes below open price.
For each successful trade You may have 3% or more return and probability of success is around 65 to 70 %.
Here one thing to remember is if market is trending upwards with high momentum then you have to screen stocks with more than 3% higher close price to maintain successful trading probability.
I am posting here AFL for amibroker user which I use to screen stocks.


Filter = Close > BBandTop( Close, 20, 2 )*1.02;
AddColumn( Close, "Close " );
AddColumn( Open, "Open " );
AddColumn( High, "High " );
AddColumn( Low, "Low " );
AddColumn( Volume, "Volume" );
 
#5
Mayur, you really rock. Don't know much about the technical software that you are using to screen such stocks. And also, don't know about the working of bollinger bands and how you drew the trend line using thick red line. I have heard about every thing like technical parameters, system, strategies and did not put anything into a plan practically. So I am practically a zero. You have developed a practical plan and hearty congratulations for that. Please elaborate with more examples and explanations (when you find time ofcourse :) ) for the benefit of losing traders like many of us. Thank you once again. Best wishes
I use Amibroker software to screen stocks.
I use getbhavcopy software to get download EOD data.
You can get lot of info. on Amibroker on traderji.
You can download software from 4shared.But using It is little bit complicated for new users.
I have posted the formula I am using to screen stocks.
 
Last edited:
#6
Mayur, you really rock. Don't know much about the technical software that you are using to screen such stocks. And also, don't know about the working of bollinger bands and how you drew the trend line using thick red line. I have heard about every thing like technical parameters, system, strategies and did not put anything into a plan practically. So I am practically a zero. You have developed a practical plan and hearty congratulations for that. Please elaborate with more examples and explanations (when you find time ofcourse :) ) for the benefit of losing traders like many of us. Thank you once again. Best wishes
Please find weblink which provide daily tech. data.

http://www.topstockresearch.com/

From friday I will post screen stocks daily and we will see results at the end of day.
 
Last edited:

udi1970

NSE FUTURES INTRADAY
#7
Second example of Andhra pradesh paper mill on same date 5/3/12
Hi Mayur, I studied the price movement of these stocks. It is noted that these stocks were on a high the previous day. So, what is the logic behind the fall? When to short these stocks? Do we have to hold the stocks till the end of day for best results? I have the following questions on your trading strategy. Please answer.

Q. 1. When exactly we can short the stock? The answer flashing on my mind is wait for the stock to cross the projected bollinger band value (from Bottom) and when it falls back below the bollinger band value again (from Top). When it falls back below the bollinger band value just short it. Is this correct?

Q. 2. Do we get best results if we hold the short positions till the end? Both charts suggest that price fell continually till the end. Is this the observed characteristic of these kind of stocks?

Thanking you

Udi
 

udi1970

NSE FUTURES INTRADAY
#8
Please find weblink which provide daily tech. data.

http://www.topstockresearch.com/

From friday I will post screen stocks daily and we will see results at the end of day.
Hi Mayur, you are tech wizard :) and way too fast for stock market illiterates like many of us :) But one thing is sure; I predict this thread is going to register high hits. It seems to me that your trading method is extremely simple and reward ratio is also high. With the expected inputs on entry and exit strategy from you this method is going to be extremely useful for the loss makers. Congrats and please keep on doing the good work.
 
#9
Hi Mayur, I studied the price movement of these stocks. It is noted that these stocks were on a high the previous day. So, what is the logic behind the fall? When to short these stocks? Do we have to hold the stocks till the end of day for best results? I have the following questions on your trading strategy. Please answer.

Q. 1. When exactly we can short the stock? The answer flashing on my mind is wait for the stock to cross the projected bollinger band value (from Bottom) and when it falls back below the bollinger band value again (from Top). When it falls back below the bollinger band value just short it. Is this correct?

Q. 2. Do we get best results if we hold the short positions till the end? Both charts suggest that price fell continually till the end. Is this the observed characteristic of these kind of stocks?

Thanking you

Udi
As I have mentioned in earlier post that the projection value of Upper bollinger band is base value above which we can short stocks.
The logic behind all this stocks falling is profit booking since most of them run because of news.
Generally stock opens 2 to 3% higher or goes higher in few minutes of market opening at that time you can short it.
One can also opt for shorting in parts i.e. as stock rise short small quantity.
About holding stock till the end of day I say one should start profit booking partially as stock come down to 2% from intraday high.
 

Similar threads