Hi friends,
I am posting one chart, pls help me analyse it..
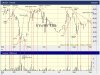
According to me the three bars numbered as 1, 2, 3 are:
1. Effort to Fall bar: It is normally found in the beginning of a Markdown phase.
2. Strength bar (upbar with higher volume closing near the high) Here the volume is very much above average, this makes the indicaton more stronger.
3. The previous bar saw strength coming back, this upbar confirms strength.
However I am unable to understand that even after strength is showing, why did the market go down.. Please help me analysing the chart.

regards..
I am posting one chart, pls help me analyse it..
According to me the three bars numbered as 1, 2, 3 are:
1. Effort to Fall bar: It is normally found in the beginning of a Markdown phase.
2. Strength bar (upbar with higher volume closing near the high) Here the volume is very much above average, this makes the indicaton more stronger.
3. The previous bar saw strength coming back, this upbar confirms strength.
However I am unable to understand that even after strength is showing, why did the market go down.. Please help me analysing the chart.
regards..
Always consider volume as bigger picture while doing VSA.
@Karthik sir,
Comeback soon.
TYVM
")