Volume Profile and Market Profile a new wave of market picture

Status
Not open for further replies.

wisp

Well-Known Member
#32
Last edited:

Purushotham

Well-Known Member
#35

wisp

Well-Known Member
#36

XRAY27

Well-Known Member
#37
Could you please post similar formula for Meta Stock?:thumb:
Sorry bro !!! i'm not expert in any software and i don't use meta stock !!!
 

XRAY27

Well-Known Member
#38
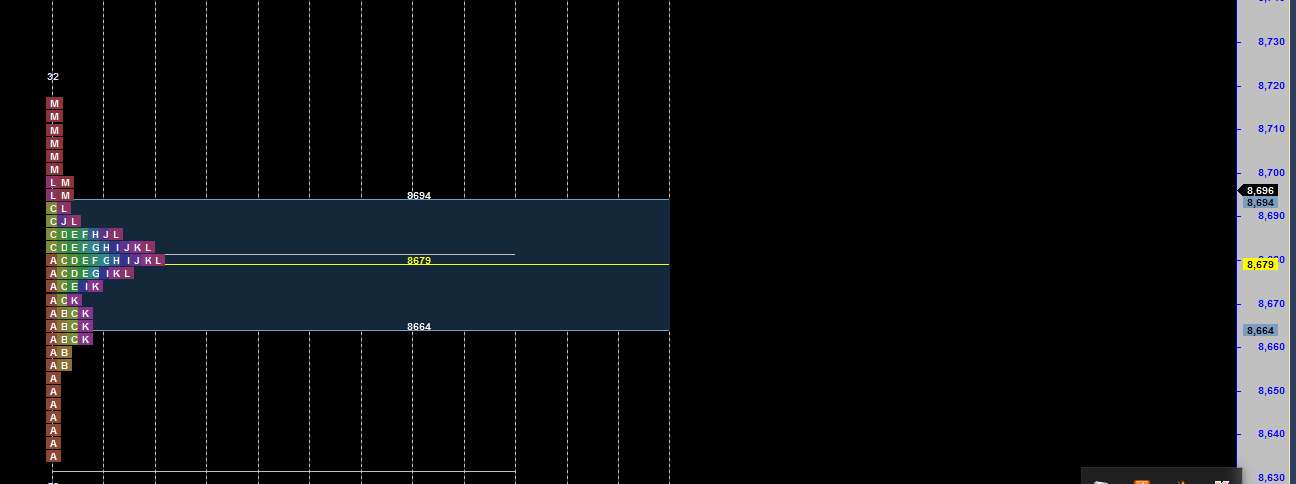
Market profile is a market's price activity recorded in relation to time in a statistical bell curve and TPO's are opportunity created by the market at a certain price at a certain time

Number at the edge of the Profile chart 33 and 50 represent TPO count !!!

TPO count of 33/50 means 33 above the POC and 50 below the POC. This indicates buyer dominance or buying control. The TPO count above the POC represents sellers willing to short above value while a TPO count below the POC represents buyers willing to buy below value. Buyers below POC view the markets as undervalued while sellers above the POC view the markets as overvalued.


XRAY27

Well-Known Member
#39

XRAY27

Well-Known Member
#40
As per the setup discussed in post# 26

DP for Monday trade of Nifty Fut are as follows

PDH: 8717


PDL :8631.6

POC :8679
 
Status
Not open for further replies.

Similar threads