Trading NF with ACD system

FlowTrader

Active Member
#61
Hi,
Todays ACD --a day of its own kind, took 35 points SL hit loss, even being on the right side of days undercurrent ( mild bullishness).
This should not be considered as curve-fitting but just a coincidence that gave reason to start analysing a parallel setup with lower value of A( or C) thats 7 points bothside,suprimposed on main setup.
( this already discussed here http://www.traderji.com/derivatives/26424-trading-nf-acd-system-4.html#post280913 )

Outcome of Parallel setup certainly will be different than main setup and this will be taken independent from main for analysis. Both have different risk-reward ratio and only live-testing over a period can evaluate the merits/demerits. However parallel setup is invoked due to ATR <100, but might be continued for testing even after ATR>100.
Hello D

Can you tell me how do you define the target?

Just started with the book.

Regards
PK
 

dumdum20008

Well-Known Member
#62
Hello D

Can you tell me how do you define the target?

Just started with the book.

Regards
PK
as u r goin thru book, u realize ACD is more for entry rather than target projection. System try to filter out trend days and makes entries statistically successfull ( as per book). Beside that, here A value for NF is adopted as per ATR and (OR+-A value) is considered best as close to 25-30% of prevailing ATR. Now in real trading one can not replicate theory, validation points shoots at approximate 40-50% of ATR and after that trade can be exacuted. So profit extraction range comes after that and hardly 25-35%(if day got lucky) of ATR can be captured ( bacause rest 20% ATR falls after 2nd SD of bell curve, and one can not always be so lucky to get a pie in that area).

[ i persanlly use ACD for entry and exit is my regular 10-15 points expectaion]
 

FlowTrader

Active Member
#63
as u r goin thru book, u realize ACD is more for entry rather than target projection. System try to filter out trend days and makes entries statistically successfull ( as per book). Beside that, here A value for NF is adopted as per ATR and (OR+-A value) is considered best as close to 25-30% of prevailing ATR. Now in real trading one can not replicate theory, validation points shoots at approximate 40-50% of ATR and after that trade can be exacuted. So profit extraction range comes after that and hardly 25-35%(if day got lucky) of ATR can be captured ( bacause rest 20% ATR falls after 2nd SD of bell curve, and one can not always be so lucky to get a pie in that area).

[ i persanlly use ACD for entry and exit is my regular 10-15 points expectaion]
Hello

Thanks for a quick response. Hope to see some increase in volatility. :)
Rgrds
PK
 

amar_gr

Active Member
#66
Hi Dumdum,

I have been trying to follow the Pivot point range alongwith the
A-up/Dn scenarios.

Just wanted to know your experiences with

a. Using the Pivot Range
b. Using the Pivot point moving averages.

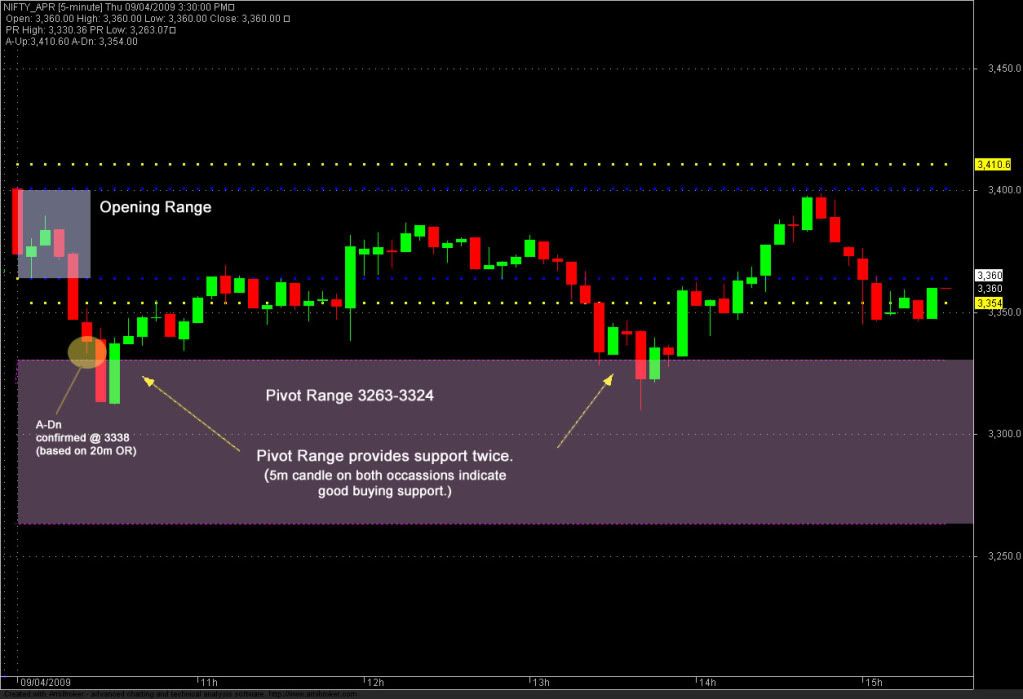
On the 1st of April, we had a good A-up thru pivot range, turned out to be a fairly profitable day, with a small risk, but got stopped out prematurely when the pivot range was tested .

Also do you know of a way to plot a pivot point moving average.
I am using amibroker but am unable to find a way to plot pivot point moving averages.

Cheers
Amar.


Blue Lines = Opening Range
Yellow Lines = A-Up/Dn
Magenta = Pivot Range
 
Last edited:
#68
amar gr will u tell me how did u get this nifty future realtime data can u hlep me out as i want realtime data feed for nifty future pls do let me know will really be nice of u to help me out for realtime data feed for nifty future

hope to hear soon regards
 

amar_gr

Active Member
#69
amar gr will u tell me how did u get this nifty future realtime data can u hlep me out as i want realtime data feed for nifty future pls do let me know will really be nice of u to help me out for realtime data feed for nifty future

hope to hear soon regards
I am using Chartsdata with Odin diet. Check out the following link on the forum.

http://www.traderji.com/software/24076-odin-realtime-data-amibroker-metastock-fcharts-excel-txt-backfill.html

Let me know if you have any furthur queries.

Cheers
Amar.
 

amar_gr

Active Member
#70
Hello

Just read through the thread. Excellent effort.

I can write a exploration in Ami to short list the days with specific OR / IB range, if that helps. Would become easy to verify mannually as per your criteria.

If you tell me the bands (for range) you are looking for will upload the dates here.

Regards
PK
Hi there Flowtrader,

I am trying to understand & use Fisher's Pivot Point moving averages.
Amibroker does not have a way to plot this kind of MA's.

Can you please help me in coding the following. I do not have any kind of programming skills, hence the request.

What I basically need is, a moving average to be plotted on a daily chart based on the daily Pivot Points. On a given chart, I need to place, multiple such moving averages, for ex. 14 day, 30 day & 50 day.

Thanks in advance.
Amar.
 

Similar threads