


Thomas DeMark Sequential System
- Thread starter leo_3455
- Start date
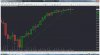

Mine is more closer to bloomberg I think as compared to grafster.Request topgeartrades to post bloomberg.The second series shows 8 in yellow even in my case, but the first series completed.
Regards
Regards
Hi
I love all your hardwork for this and here is my developed afl i made it on tomdemark i have still some final stage to set this one with my wave count when complete i will share it for this forum .Please give me your feed back to improove it this is some of which i am currently using it with my experience on tomdemark count since last 8 years
and here is the afl
//TD Setup
pivot_dw = Ref(C,-1)>Ref(C,-5) AND C<Ref(C,-4);
pivot_up = Ref(C,-1)<Ref(C,-5) AND C>Ref(C,-4);
pivot_dw_dist = BarsSince(pivot_dw);
pivot_up_dist = BarsSince(pivot_up);
under4th = C<Ref(C,-4);
upper4th = C>Ref(C,-4);
TDset_buy = IIf(pivot_dw_dist==Sum(under4th,pivot_dw_dist),pivot_dw_dist,0);
TDset_sell = IIf(pivot_up_dist==Sum(upper4th,pivot_up_dist),pivot_up_dist,0);
TDset9_buy = TDset_buy==9;
TDset9_sell = TDset_sell==9;
LLVL2 = LLV(L,2);
HHVH2 = HHV(H,2);
setBuy_perf = LLVL2<=Ref(LLVL2,-2) AND TDset_buy>=9;
setSell_perf = HHVH2>=Ref(HHVH2,-2) AND TDset_sell>=9;
//TD Countdown
setBuy = Flip(TDset9_buy,TDset9_sell);
setSell = Flip(TDset9_sell,TDset9_buy);
TDSTrs = ValueWhen(TDset_buy==9,H,1);//ValueWhen(TDset_buy==1,H,1),1);
TDSTsp = ValueWhen(TDset_sell==9,L,1);//ValueWhen(TDset_sell==1,L,1),1);
/* TDCount original
DwCond = C<=Ref(LLVL2,-1);
UpCond = C>=Ref(HHVH2,-1);
*/
//TDcount modified
DwCond = L<Ref(LLV(L,BarsSince(Ref(setBuy,-1)==0 AND setBuy==1)),-1);
UpCond = H>Ref(HHV(H,BarsSince(Ref(setSell,-1)==0 AND setSell==1)),-1);
TDcountBuy = IIf(setBuy,Sum(IIf(setBuy AND DwCond,1,0),BarsSince(setBuy>Ref(setBuy,-1)))+9,0);
TDcountSell = IIf(setSell,Sum(IIf(setSell AND UpCond,1,0),BarsSince(setSell>Ref(setSell,-1)))+9,0);
CountBuyComplete = IIf(TDcountBuy>=13 AND C<ValueWhen(TDcountBuy==8,C,1),1,0);
CountSellComplete = IIf(TDcountSell>=13 AND C>ValueWhen(TDcountSell==8,C,1),1,0);
x=Cum(1);
for( i = 0; i < BarCount; i++ )
{
if((TDcountBuy==1 AND TDcountBuy[i-1]!=1) OR (TDcountBuy==3 AND TDcountBuy[i-1]!=3) OR (TDcountBuy==5 AND TDcountBuy[i-1]!=5) OR (TDcountBuy==7 AND TDcountBuy[i-1]!=7) OR (TDcountBuy==9 AND TDcountBuy[i-1]!=9) OR (TDcountBuy==13 AND TDcountBuy[i-1]!=13) OR (TDcountBuy==26 AND TDcountBuy[i-1]!=26) OR (TDcountBuy==38 AND TDcountBuy[i-1]!=38))
{
PlotText(NumToStr(TDcountBuy,1.0),i,L-5,colorBlack,colorWhite);
}
if((TDcountSell==1 AND TDcountSell[i-1]!=1) OR (TDcountSell==3 AND TDcountSell[i-1]!=3) OR (TDcountSell==5 AND TDcountSell[i-1]!=5) OR (TDcountSell==7 AND TDcountSell[i-1]!=7) OR (TDcountSell==9 AND TDcountSell[i-1]!=9) OR (TDcountSell==13 AND TDcountSell[i-1]!=13) OR (TDcountSell==26 AND TDcountSell[i-1]!=26) OR (TDcountSell==38 AND TDcountSell[i-1]!=38))
{
PlotText(NumToStr(TDcountSell,1.0),i,H+5,colorRed,colorYellow);
}
}
_SECTION_BEGIN("Price");
SetChartOptions(0,chartShowArrows|chartShowDates);
_N(Title = StrFormat("{{NAME}} - {{INTERVAL}} {{DATE}} Open %g, Hi %g, Lo %g, Close %g (%.1f%%) {{VALUES}}", O, H, L, C, SelectedValue( ROC( C, 1 ) ) ));
Plot( C, "Close", ParamColor("Color", colorBlack ), styleNoTitle | ParamStyle("Style") | GetPriceStyle() );
_SECTION_END();
This code is showing error.
Smart_trade
Smart_trade
Corrected the error. It was just a space between "pi vot" on 2 lines. I have just come across this wonderful trading logic by tom demark a few days ago. I am going to study this further and see how it goes. So far all the afl I hav found are not very reliable since most of them don't begin a count once the buy or sell is accomplished. there is no filter for taking a new count cycle.
Code:
//TD Setup
pivot_dw = Ref(C,-1)>Ref(C,-5) AND C<Ref(C,-4);
pivot_up = Ref(C,-1)<Ref(C,-5) AND C>Ref(C,-4);
pivot_dw_dist = BarsSince(pivot_dw);
pivot_up_dist = BarsSince(pivot_up);
under4th = C<Ref(C,-4);
upper4th = C>Ref(C,-4);
TDset_buy = IIf(pivot_dw_dist==Sum(under4th,pivot_dw_dist),pivot_dw_dist,0);
TDset_sell = IIf(pivot_up_dist==Sum(upper4th,pivot_up_dist),pivot_up_dist,0);
TDset9_buy = TDset_buy==9;
TDset9_sell = TDset_sell==9;
LLVL2 = LLV(L,2);
HHVH2 = HHV(H,2);
setBuy_perf = LLVL2<=Ref(LLVL2,-2) AND TDset_buy>=9;
setSell_perf = HHVH2>=Ref(HHVH2,-2) AND TDset_sell>=9;
//TD Countdown
setBuy = Flip(TDset9_buy,TDset9_sell);
setSell = Flip(TDset9_sell,TDset9_buy);
TDSTrs = ValueWhen(TDset_buy==9,H,1);//ValueWhen(TDset_buy==1,H,1),1);
TDSTsp = ValueWhen(TDset_sell==9,L,1);//ValueWhen(TDset_sell==1,L,1),1);

/* TDCount original
DwCond = C<=Ref(LLVL2,-1);
UpCond = C>=Ref(HHVH2,-1);
*/
//TDcount modified
DwCond = L<Ref(LLV(L,BarsSince(Ref(setBuy,-1)==0 AND setBuy==1)),-1);
UpCond = H>Ref(HHV(H,BarsSince(Ref(setSell,-1)==0 AND setSell==1)),-1);

TDcountBuy = IIf(setBuy,Sum(IIf(setBuy AND DwCond,1,0),BarsSince(setBuy>Ref(setBuy,-1)))+9,0);
TDcountSell = IIf(setSell,Sum(IIf(setSell AND UpCond,1,0),BarsSince(setSell>Ref(setSell,-1)))+9,0);
CountBuyComplete = IIf(TDcountBuy>=13 AND C<ValueWhen(TDcountBuy==8,C,1),1,0);
CountSellComplete = IIf(TDcountSell>=13 AND C>ValueWhen(TDcountSell==8,C,1),1,0);

x=Cum(1);
for( i = 0; i < BarCount; i++ )
{
if((TDcountBuy[i]==1 AND TDcountBuy[i-1]!=1) OR (TDcountBuy[i]==3 AND TDcountBuy[i-1]!=3) OR (TDcountBuy[i]==5 AND TDcountBuy[i-1]!=5) OR (TDcountBuy[i]==7 AND TDcountBuy[i-1]!=7) OR (TDcountBuy[i]==9 AND TDcountBuy[i-1]!=9) OR (TDcountBuy[i]==13 AND TDcountBuy[i-1]!=13) OR (TDcountBuy[i]==26 AND TDcountBuy[i-1]!=26) OR (TDcountBuy[i]==38 AND TDcountBuy[i-1]!=38))
{
PlotText(NumToStr(TDcountBuy[i],1.0),i,L[i]-5,colorBlack,colorWhite);
}
if((TDcountSell[i]==1 AND TDcountSell[i-1]!=1) OR (TDcountSell[i]==3 AND TDcountSell[i-1]!=3) OR (TDcountSell[i]==5 AND TDcountSell[i-1]!=5) OR (TDcountSell[i]==7 AND TDcountSell[i-1]!=7) OR (TDcountSell[i]==9 AND TDcountSell[i-1]!=9) OR (TDcountSell[i]==13 AND TDcountSell[i-1]!=13) OR (TDcountSell[i]==26 AND TDcountSell[i-1]!=26) OR (TDcountSell[i]==38 AND TDcountSell[i-1]!=38))
{
PlotText(NumToStr(TDcountSell[i],1.0),i,H[i]+5,colorRed,colorYellow);
}
}

_SECTION_BEGIN("Price");
SetChartOptions(0,chartShowArrows|chartShowDates);
_N(Title = StrFormat("{{NAME}} - {{INTERVAL}} {{DATE}} Open %g, Hi %g, Lo %g, Close %g (%.1f%%) {{VALUES}}", O, H, L, C, SelectedValue( ROC( C, 1 ) ) ));
Plot( C, "Close", ParamColor("Color", colorBlack ), styleNoTitle | ParamStyle("Style") | GetPriceStyle() );
_SECTION_END();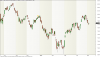
| Thread starter | Similar threads | Forum | Replies | Date |
|---|---|---|---|---|
| R | Thomas Cook shares | Equities | 2 | |
| F | need afl conv "Moving beyond the closing price" by Thomas Stridsman-tradestation code | AmiBroker | 0 | |
| R | thomas cook | Position Trading | 0 | |
| Y | Thomas N. Bulkowskis patterns | AmiBroker | 4 | |
| A | pivots used by Thomas DeMark | AmiBroker | 7 |
Similar threads
-
-
need afl conv "Moving beyond the closing price" by Thomas Stridsman-tradestation code
- Started by ford7k
- Replies: 0
-
-
-