Teach Me To Fish

bashasm

Well-Known Member
#13
@abhijit sen
Good start brother, I have also decided to restart trading from June 4th. I am also looking to scalp one minute charts.
I see you trade the naked charts, don't you like adding any indicators like Pivot points or moving averages, I know some people don't like indicators.
 
#14
@abhijit sen
Good start brother, I have also decided to restart trading from June 4th. I am also looking to scalp one minute charts.
I see you trade the naked charts, don't you like adding any indicators like Pivot points or moving averages, I know some people don't like indicators.
Thank you basha for the kind words of encouragement. I am not much of an indicator guy. Too much information tends to confuse me.

I am relying on price, volume and support-resistance. I am hoping that getting more screen time under my belt will improve my price action reading.
 
Last edited:

bashasm

Well-Known Member
#15
Thank you basha for the kind words of encouragement. I am not much of an indicator guy. Too much information tends to confuse me.

I am relying on price, volume and support-resistance. I am hoping that getting more screen time under my belt will improve my price action reading.
Sure brother, Let us learn together in the journey
 
#18
I took 2 trades today.

Trade 1

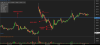
Tata Motors had a gap-up open but sold off immediately. I had marked Friday's high, just above the 290-zone, as potential support area. But that level failed to hold, and i sold short at 289.70, with an initial stop loss above the last pivot high at 291.40. I covered half my position at 288.60 and trailed the stop lower to 290.70. I then squared-off 1/4th of my position at 288.20 and moved the stop to break-even. The remaining 1/4th was covered at 287.60. Profit = Rs. 1.45.

Trade 2

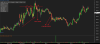
Tata Steel was plotting higher highs and higher lows since open. It formed a double top around 567.50, which marked a significant resistance zone. The subsequent break above failed to follow through, resulting in a pull-back. I was expecting prices to rebound from around 567.50 that had now turned in to a support area. When that level did not hold, i sold at 565.70, with an initial stop loss at 567.70. I covered half my position at 564.60 and trailed the stop lower to 567.30. I then squared-off the remainder at 563.60. Profit = Rs. 1.60.
 

Attachments

Last edited:
#19
I took 1 trade today.

ICICI Bank opened weak to plot a distinct trough. It produced a shallow pullback, post which prices breached the prior low. I "rushed" and entered on a break below that low at 284.70, with a stop loss above the last price peak at 286.30, and an initial target of 283.60. Prices meandered for a long while before finally hitting my stop. Loss = Rs. 1.60.
 

Attachments

Last edited:
#20
I took 2 trades today.

Trade 1

Hindalco had a moderately strong open. It rose to find resistance around yesterday's high. Prices consolidated there for a few bars, before rising higher. It pulled back to around yesterday's high, which had now turned to support, where a bullish candle with a long tail was plotted. I went long on a break above that bar at 243.80, with a stop loss below the candle at 242.70. I booked out at 244.80. Profit = Rs. 1.00

Trade 2

Hindalco subsequently printed a bearish head and shoulders, with a neck-line around 244.20. I managed to enter short at 243.85 and was looking for a target of 243.20, which was the height of the pattern. I covered a few bars later. Profit = Rs. 0.65
 

Attachments

Similar threads