Dear Friends,
My name is Sandy, my analysis usually is biased towards technical analysis. I believe it works the best for me. In this thread I will utilize few technical tools in my arsenal to see its effectiveness in analyzing the Indian stock market. My primary focus will be NIFTY.
---------------------------------------------------------
January 20th 2011 (5:13 PM)
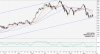
This is Nifty's yesterday (daily) chart, which shows a divergence in price and RSI (see attached chart, shaded area). The price made a new low, whereas the RSI failed to move lower. This gives us an indication that prices have lost their strength in moving down.
Also prices are resting on the trend channel drawn since july of 2009. Prices should push off and NIFTY (Indian Markets) should see some strength for a few days.
EXPECTATIONS
Target Range: 5800 to 5900
One could define risk, if prices break and close below 5600.
My name is Sandy, my analysis usually is biased towards technical analysis. I believe it works the best for me. In this thread I will utilize few technical tools in my arsenal to see its effectiveness in analyzing the Indian stock market. My primary focus will be NIFTY.
---------------------------------------------------------
January 20th 2011 (5:13 PM)
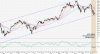
This is Nifty's yesterday (daily) chart, which shows a divergence in price and RSI (see attached chart, shaded area). The price made a new low, whereas the RSI failed to move lower. This gives us an indication that prices have lost their strength in moving down.
Also prices are resting on the trend channel drawn since july of 2009. Prices should push off and NIFTY (Indian Markets) should see some strength for a few days.
EXPECTATIONS
Target Range: 5800 to 5900
One could define risk, if prices break and close below 5600.
Attachments
-
 49.9 KB Views: 174