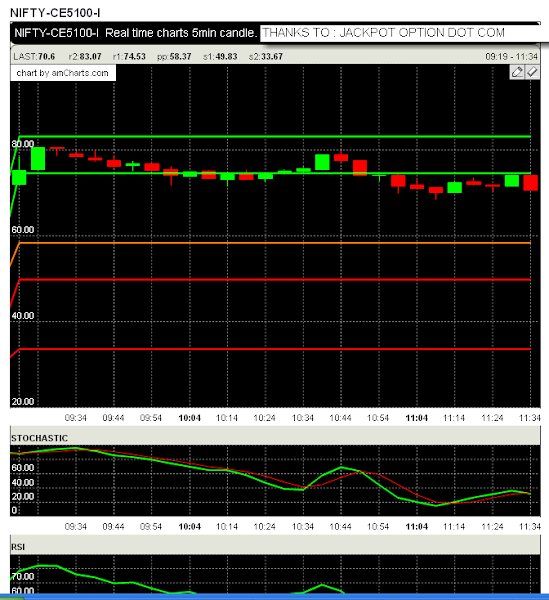
Nifty option live charts
Six techniques are provided for buying or selling the stock from the above nifty option charts
Support - resistance lines, Stochastics oscillator, Relative Strength index,
Moving average convergence divergence, buy sell signal indicators and trend line marker
Support - resistance lines helps in knowing the trend of nifty option by its position
Buy above every line keeping stoploss as the below line and target as the above line
short sell nifty option when it cuts any line with target as the below line and stoploss as the above line.
Stochastic oscillator is best useful in consolidated or range bound markets due to its nature of momentum.
It is said that stock re-bounces when it reaches 20 on stochastic indicator and fall when it reaches 80.
So, buy the stock when the reading is around 20 and sell when it is around 80.
RSI also follows the same rule with notable boundaries as 30 and 70 on nifty option charts.
Traders following RSI can buy at 30 and sell at 70 as the movement is less compared to stochastics.
Using MACD, one can buy when the signal line is above 0 line and sell when the oscillator is below 0 line.
Startes of stock market just buy the stock when buy signal appear on the chart.
Sell bank nifty when red coloured down arrow appears on the nifty option charts.
It is suggested to use trend lines method only if you are an expert in the stock market.
Join all the higher highs and buy the stock if it breaks the joinging line.
In bear market, join all the lower lows and sell the stock if breaks the trending line.
chart link


