


Disclaimer: These are my personal musings and only meant for entertainment, not as trading advise. The link for the full chart is below this post.
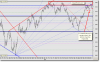
On strong global cues, the Nifty opened with a gap. It kept hammering away on the upside at the Resistance Zone, almost throughout the day. Just goes to show how strong that resistance zone has become. On a low volumes day, coupled with some disappointing results from a couple of Index heavyweights, it tanked towards the end.
It really was a flattish kind of day. The Index has managed to keep above the previous swing low, which I have marked out in red. I have also marked out the rising swing tops in blue. This is a very short term observation.
With the mood being suddenly bearish in the last hour or so, we may see some extension selling tomorrow. Maybe the previous swing bottom could also be tested.
Now, stepping back a little, we will observe that the intermediate term trend is still up. The Nifty has not as yet violated any of those levels, which I depend on, using my personal indicators. And when the intermediate trend is up, and the short term trend inclines down, our reaction should be to buy on dips. In any case, the fact is that the Nifty has turned rather flat. And when the volatility narrows down, we normally tend to get a sharp move. It could be that we have a sharp move down! Bulls could use this opportunity to enter the market.
In case the Nifty does violate the low 3110 of a few days ago, the pattern could turn out to be an expanding triangle. An expanding triangle is one where the price makes two or three lower lows and higher highs. That is considered to be a bullish consolidation pattern. And usually, the price breaks out to the upside.
As I have been oft repeating, stops and/or hedging are a must when indices open gap up or down.
Finally, trade happy.
Attachments
-
 30.1 KB Views: 104
Last edited: