Disclaimer: These are my personal thoughts and not trading advise.
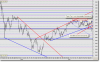
How the technical position changes within a span of two trading days. The Nifty opened with a downside gap, and continued down. We have readjusted the blue up sloping trendline to accommodate the minor incursions of the rising trend. This trendline, which has been providing strong support all along this rise, has been broken decisively today. A loose head and shoulder pattern has also taken effect on the hourly chart. The shoulders are marked S and the head H.
Now that the short term trend is down, any rises will be accompanied by heavy selling. Which will in turn depress the sentiment even more.
Unfortunately, for the index, it will now take huge buying to reverse its trend.
Now let us look at the positive side. Normally, we see that a sharp rise or drop like this is followed by profit booking covering, which allows the minor trend to reverse. In this case, we could see short covering. Further, the loose H&S pattern has almost completed its 100 point amplitude target.
We could therefore, see a minor upward reversal, which could allow the Nifty to test 3040 to 3065. From there, we could see further selling pressure which could push it down to approximately the 2930 levels. We could possibly see the index heavyweights bottoming around those levels, which could allow the Nifty to begin a fresh up move.
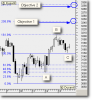
A couple of days back I had uploaded a projections chart. The reader would notice that the projections were drawn up with the 3057 level as a base and 3147 as the minor pivot. Both these levels have been violated. Therefore, the earlier projections based on this chart, have been negated, and are discarded.
As of now, sell on rises could be the prudent thing to do.
How the technical position changes within a span of two trading days. The Nifty opened with a downside gap, and continued down. We have readjusted the blue up sloping trendline to accommodate the minor incursions of the rising trend. This trendline, which has been providing strong support all along this rise, has been broken decisively today. A loose head and shoulder pattern has also taken effect on the hourly chart. The shoulders are marked S and the head H.
Now that the short term trend is down, any rises will be accompanied by heavy selling. Which will in turn depress the sentiment even more.
Unfortunately, for the index, it will now take huge buying to reverse its trend.
Now let us look at the positive side. Normally, we see that a sharp rise or drop like this is followed by profit booking covering, which allows the minor trend to reverse. In this case, we could see short covering. Further, the loose H&S pattern has almost completed its 100 point amplitude target.
We could therefore, see a minor upward reversal, which could allow the Nifty to test 3040 to 3065. From there, we could see further selling pressure which could push it down to approximately the 2930 levels. We could possibly see the index heavyweights bottoming around those levels, which could allow the Nifty to begin a fresh up move.
A couple of days back I had uploaded a projections chart. The reader would notice that the projections were drawn up with the 3057 level as a base and 3147 as the minor pivot. Both these levels have been violated. Therefore, the earlier projections based on this chart, have been negated, and are discarded.
As of now, sell on rises could be the prudent thing to do.