


Hello Friends,
Greeting! I am new learning amibroker coding and have been in this for the last few months. I am looking for a code to draw a slope line between 2 points
example line between today's high and today's low , between yesterday's high yesterday's line. Likewise making a zigzag patteren between the time interval highs and lows. Can someone please help me with the code. I would be very thankful.
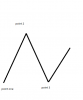
I am attaching a picture to make things understand what i actually need.
I have tried using the linearray function but could not make it work
Greeting! I am new learning amibroker coding and have been in this for the last few months. I am looking for a code to draw a slope line between 2 points
example line between today's high and today's low , between yesterday's high yesterday's line. Likewise making a zigzag patteren between the time interval highs and lows. Can someone please help me with the code. I would be very thankful.
I am attaching a picture to make things understand what i actually need.
I have tried using the linearray function but could not make it work
Attachments
-
 5.5 KB Views: 60
")