


MACD
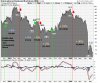
I'm attaching a chart of IBM Stock as an example of entering Long and Short positions whenever MACD thick black line crossed above 0% or subsequently crossed below 0%.
the chart is a little over a year, but because this is the only sample data being presented, it may not be a valid correlation. Play around with it and determine if this is something you'd like to employ from time to time as an added signal.
I'd like to hear if anyone has had much success using this technique singularly or in association with other signals. I regularly use Moving Averages exclusively, but may use MACD in addition to.
MasterChief
Attachments
-
 56.1 KB Views: 165
Last edited:
")