Hi Cubt,
Thanks for sharing this strategy. With a simple formula in Snapexcel file in Tradetiger I was testing for past 3 days. There were no trades. Today 4 stocks came positive. Reddys, Manappuram, and Chennai petro and one more. Of these, I chose DrReddys as it was showing highest increase from yesterdays vol at 9:30 pm. Got 1% profit. Re-entered and got some more, but could not square off because it went into delivery and the squareoff was not working on the site at 3:20 pm. I guess I was greedy. I am planning to start a separate thread for the daily results of this strategy.
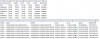
To Any body interested, the excel formula is in the screenshot below: (S is the name of the worksheet in your data streaming excel file)