I am a complan boy

#11
Another day of trading, not too great today, a few mistakes killing the profit...but oh well, happy to finish in the green zone though...sorry for the long wall of text, but mistakes always warrant more discussion :annoyed:

First trade was in Karnataka Bank, using the NR7 strategy...modified. It opened below the previous day low, but jumped up above that and kept going up. I got in early and exited it after it had gained 2 points, giving me a 3% profit in 30 minutes after trading started...should have closed shop and done something else :(

Ignoring my own rule of trading in only one stock per day, I moved to HDFC for the rest of the day....where I stumbled and fumbled along like an idiot :(


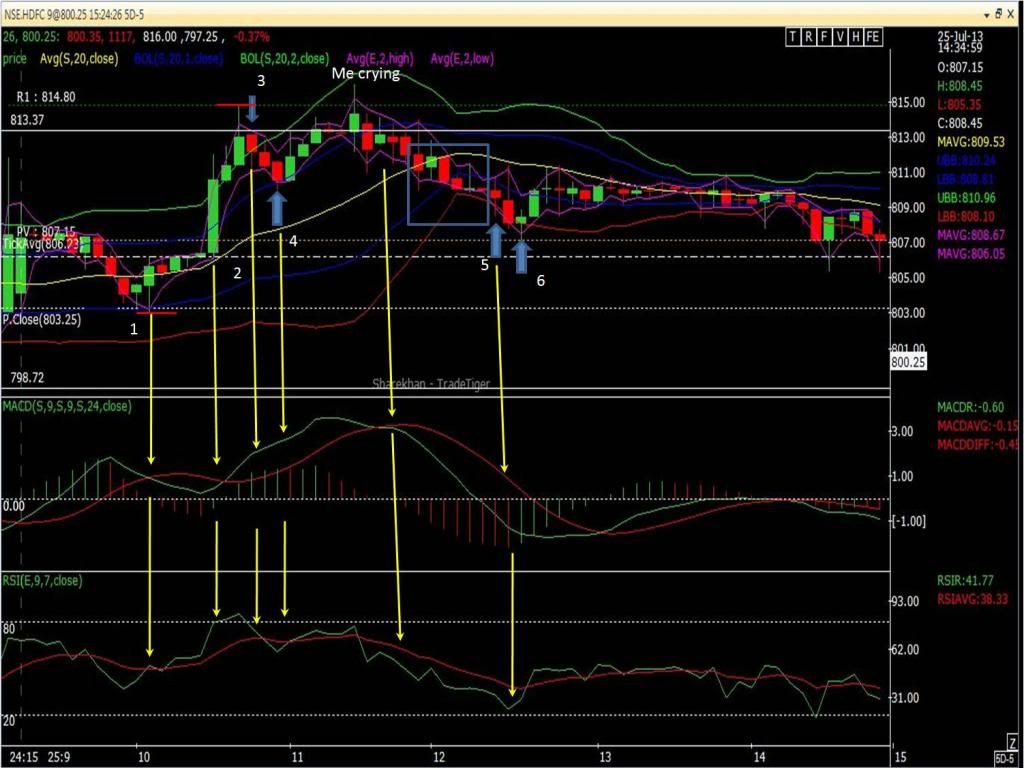
1) The long green candle caught my interest. It marginally cut the low of the previous candle, indicating a decrease in the downward momentum. The RSI and MACD also suggested a possible trend change. It had not cut the bottom BB line for BB (20,1), suggesting that it was using it as a resistance. All bells ringing towards a possible upward trend starting soon.

Also, that green candle formed when the NIFTY was in a strong downward momentum, suggesting that this strong is resisting and is currently quite oblivious to the NIFTY movement. Still wary, I put a buy order using a trigger price at 806.50, 0.30 points above the high of this candle...

2) The price triggered my buy order and it was executed at 806.50. I immediately set a stop loss at 803, which is the low of the big green candle in 1....marked by the red horizontal line.

The points in my favour were the fact that the price is above the BB centre line and the RSI was showing an uptrend. However, the MACD picture was not all rosy, which made it a half hearted buy position..

3) Exit from long position. The price did not break the resistance line of 814.80, the RSI was going down and the red candle marginally broke the low of the previous green candle. Exit at 813..

4) My second mistake of the day, trying to go short at this point. The EMA-2-high had cut the upper BB line and returned within the BB Band. The price had just bounced down from a resistance line and the green histogram lines in the MACD were slowing down suggesting a downward trend. Went short at 811 with a stop loss set at 815, which is just above the high of the green candle before 3.

Now introducing the heartache candle, which is the next candle formed after you take a long/short position, which breaks the high/low of the previous candles that formed the trend...almost hitting your stop loss :D

The green candle that followed did exactly that, gave me a heartache. Should have been signal enough for me to pack my bags and exit from the trade. My third mistake of the day, was to stay in the trade, hoping for the impossible, a trend reversal against all odds. Unfortunately it did not happen and the price reached 816, triggering my stop loss. Entered short at 811, stop loss triggered at 815....me crying :D :D

Immediately after I started crying, the MACD, RSI and price....joined together in holy matrimony, and went on a downtrend.... :mad:

5) The first red candle in the box had made a low of 810, but subsequent candles were unable to break it. It acted as a strong support, with the other candles coming close to it. Furious with the previous trade going haywire, I decided to go short again....which is usually a BIG MISTAKE...worked out on this rare occasion though...

Went short at 809.90, when the support of 810 was broken, with a stop loss of 816, the price that made me cry earlier. Only after I entered the trade did I realize that neither the MACD, RSI or BB worm were fully in my favour. The price was close to the BB bottom line, the MACD histogram was slowing down and the RSI was near rock bottom. Not a good time to take a short position.....and over and above all this I was furious....bad bad trade...

6) The candle that followed 5, was another heartache candle, almost making me faint. However, the price dropped near 807, allowing me to exit the bad trade at 807.50, with a marginal profit......the price later on hit 800 at 15:00...:confused:

So in summary, I made a profit of 5% today, largely thanks to the first trade of Karnataka Bank. The following trades with HDFC, were stupid and mixed with emotional blunders......a good lesson learnt today...don't overdo stuff that you don't fully understand and follow your own damn rules. :(
 

columbus

Well-Known Member
#12
Hi Raasaa,

Karnataka bank is now in down-trend .It is a good stock but not as a Trading Stock.
 
#14
Good trading day today, with 5% profit within 1 hour of trading. Exited trade, took home the profits and started gearing up for the weekend :thumb:

Relatively simple trade today, given the fact that everything went my way. Picked Bharti Airtel, one of the NR7 equities. Based on previous day low, I was going to short if it crossed 333...


1) A perfect start with the first candle and the EMA-2-High cutting the upper BB line. To my eyes this candle is a spinning top, indicating indecision....not sure yet which way the trend will go.
The nifty however, with the first candle, suggested a downward trend...

2) My entry point for short, at 334.30. The previous 2 candles had formed an inside bar and the previous candle was a doji star, indicating another point of indecision. I decided to take a short position if the low of the big red candle was cut, as shown by the green horizontal line.

Once the green line was cut, I waited for price to bounce back and took a short position. The MACD was also showing a nice smooth downtrend and the RSI was below its avg. The stop loss was 336, which is the centre of the big red candle and also is the BB center line at this stage....

3) & 4) Both these candles have a low of 333, showing that there was strong resistance there. Also, 333 was supposed to be my previous entry point, based on the NR7 strategy. Ideally, I would have panicked and considered squaring off here...but the MACD was continuing on the smooth downward momentum with no signs of reversing.
Also, the NIFTY was going up by leaps and bounds, while this equity was relatively calm. Further gave me confidence to stay in this trade, waiting for the price to break 333.

5) Exit from short position, at 331.20. The MACD was slowing down with the formation of a green histogram line. The price had cut the lower BB line as well. Signals enough for a safe exit with profit.

Nice and easy day....if everyday was like today, it would be great :clap:
 
#15
A no trade day today....none of the stocks that I was watching gave any desirable action or signals for entry.

Will be watching Sun TV tomorrow, was 3IIB today and is going to be NR7/NR21 for tomorrow.
 
#16
Courage or Stupidity​

A very nice trading day, with a minor scare in between, had me almost pooping bricks...

Traded in DLF today, which was a NR7 stock, picked using keystockslite software. The overall market was trending downward and for the most part it stayed between both the lower BB bands or between the lower BB band and the center line. Almost any short position would have been profitable today....

Based on NR7 strategy, the previous low of 166.9, if breached, would present a selling opportunity in DLF....


1) As per my strategy, the price dropped below 166.9, triggering my sell order at 166.8 and executing it. The price had also just cut below the bottom BB line and the EMA-2-low was also going below the bottom BB line. The RSI and MACD was also indicating a downtrend...perfect entry point considering all the indicators and tools that I use. :clapping:

2) Should have squared off and exited the trade when the EMA-2-low cut the BB line and re-entered back into the BB band. I decided to stay in the trade a little longer, since the NIFTY was trending downwards anyway.

The price moved sideways for the most part with the MACD and RSI indicating an uptrend. I ignored all these based on the NIFTY movement and the fact that the BB bands was converging.

3) As I expected, the price dropped further, after a lot of struggle to go against the NIFTY trend. I squared off at 162, content with the 10% profit earned.

The MACD and RSI were indicating a continuation of the downtrend, but since I was content with the profit, I exited the trade.

4) At this point, as pointed out earlier, the price made a new low, which was below the previous 52wk low for this share. The previous 52wk low being 161.20 and the price touched 161.

Two things can happen at this point, when a new 52wk low is made. The price can drop down further by quite a bit before stabilizing OR it can bounce back in a strong uptrend. The former being more probable than the latter.

I entered the trade at 161, seeing the MACD and RSI were favoring a downtrend. Also, the EMA-2-low and the price had cut the bottom BB band. Based on the previous trend earlier in the day, I was expecting the price to keep going down and come back into the band at a later stage...

Unfortunately, the price decided to make higher highs and went on an uptrend. I did not set a stop loss and decided to wait things out, very sure that the price will drop down. The MACD and RSI were indicating an uptrend and the price had cut the 2nd lower BB line and crossed the centre line. All alarm bells were ringing and I was feeling very stupid...kicking myself in the rear....for entering at such a stupid time....


5) If the candle at 5 and the subsequent green candle, had continued making new highs than the previous uptrend, I would have been in a soup. Those were some tense moments, not knowing which way the price was going. The NIFTY was also making some upmoves, making the situation even worse. If the price had decided to make a breakout in the upward direction, I would have lost nearly half my profit, if not all cos had no stop loss set....

Ideally, I would have exited the trade at 5, minimizing my loss to 2%. Fortunately, the trend reversed, the first indication coming from the red MACD histogram after 5. Whew, finally, go go go go down baby...

6) Once the price broke the 52wk low again, I eased back and was sure that the price will drop down lower. Set a target at 159 and waited for the inevitable....and slowly but surely the price dropped, squaring off at 159 with a 4% profit. Not worth all the tense moments that I had to endure between 4,5 and 6 :(

DLF went even lower, to make a new 52wk low of 157, but I was content with exiting at 159 and taking home the profit.

Entering at 4 and staying in the trade without a stop loss, even though the indicators were against it, is definitely stupidity. The only reason I could afford to do so was because of the profit I had made earlier and the NIFTY's continued downtrend. As columbus mentioned in one of his threads, these EOD charts look pretty neat and clear, but it is an entirely different ball game when doing it in the live market :(

SUN TV did do some funny things today and would have been a good trade later in the day. Since I was already knee deep in DLF, I did not dare venture out anywhere else...
 
#17
Another no trade day, was indulging myself in scuba diving off pondicherry coast :D :D

All the NR7 stocks that I had shortlisted did great though, especially in the first half of the day when NIFTY went down like a ton of bricks....

making plans for tomorrow..... cheerio
 
#18
Brilliant trade day.....thanks to Finantech, made 102% profit....with an entry at 370 and exit at 315. I could have stayed longer until the price reached 240 and walked away with 300% profit.....naaa, very happy with what I got.

No point posting charts for this trade.....all it did was go down down down with a little sideways movement. Not sure what happened after 11:00 am, cos by that time I shut down trading and moved onto other things for the day :D
 

anup

Well-Known Member
#19
Brilliant trade day.....thanks to Finantech, made 102% profit....with an entry at 370 and exit at 315. I could have stayed longer until the price reached 240 and walked away with 300% profit.....naaa, very happy with what I got.

No point posting charts for this trade.....all it did was go down down down with a little sideways movement. Not sure what happened after 11:00 am, cos by that time I shut down trading and moved onto other things for the day :D
Congrats ...
:clap::clap:
 
#20
Going with and against the flow​

The previous day's nifty movement had sent most equities reeling in either direction. This lead to minimal or no equities with good volume that fell into the NR7/NR21 category. Only TechM fell into this category and I don't normally trade in stocks with a value above Rs 1,000. Just a personal taboo cos they are capable of giving large profits and heavy losses in equal proportions. Having lost nearly 50% of my capital in the L&T crash on 22nd May, i strictly stay away from these equities.

I ventured out and picked equities that fell under the 3IIB (inside inside bar) or the Near Doji category. That gave me a list of 5 equities, Wipro, Tatachem, NTPC, L&T and AuroPharma. Did my homework the previous night and marked out the resistance support levels based on their past movement and candles.

Auropharma was the first to react and cut the support lines, as shown in the insert on the top right hand corner. The numbers above the candles show the low value for that candle. Since its a 3IIB, I would have to wait for the price to drop below 158.25 before I can safely enter the trade. Some people would recommend entering below 161.25...many different theories on how to trade 3IIB pattern. The price action might lose momentum by the time it breaks the 3rd support line, giving a very small gain, but I feel its the safest bet....personal opinion again.


The insert in the top right hand corner shows the various support levels that the price would need to break before I take the trade.

1) The first candle is a very important candle. It can tell us a lot about the direction in which the price will move for the day. In this case, the first candle is almost a Marubozu. The OPEN and HIGH are same, which usually means that the price is going down for the day. Great, gives us something to start off with. I still needed the price to break 158.25 before I entered the trade.

2) The price already cut the first support level, the MACD and RSI were in favor of a downtrend. Could have a good entry point, but sticking to my rules, I was waiting for it to cut 158.25 before I entered...

3) A nice big red candle crashing through all support levels. Normally I would have set a sell order just below 158.25 with a suitable trigger price, this time I didnt. Still wary about how this equity will behave since its my first time trading in this particular equity.

Also, big drops like that, if not news based, can be followed by a big green pull back candle. Given the already falling trend, it should not happen, but one never knows. No entry yet....still waiting for a sign from Zeus himself before I enter the trade :p

4) A spinning top candlestick formation. This can be interpreted as an end to the current price trend, suggesting a reversal. The RSI was also just below 20 and the MACD was not showing great momentum....and the price was below the red BB line. Not a good time to go short, however I was considering going long now ;)

5) Finally the price broke the resistance of 158.25, comprehensively and closed above that, a nice signal for long position. The RSI was moving up and the MACD was going green. The price had also broken the 2nd lower BB line....took a long position in the next candle, at 158.8..

This was a pretty risky move, given the fact that almost all signals were showing a downtrend today. Also, the NIFTY was not showing any signs of going up....I was clearly going against the flow...risky risky.

The stop loss was 158, which is just below the support line of 158.25. I could afford to take the risk and the loss would have been within perfectly acceptable limits for me.

6) Exit at 161 for a 4% gain. The price hit 161 (shown by the red line) and did not push any further for 2 consecutive candles. When the 3rd candle also hit 161 and remained immobile for some time, I exited the trade.

If the price had broken 161, it would have jumped and gone up by a lot, but that was a risky chance since I was already trading against the trend....

Deciding to go with the trend, I put a sell order at 159.5 (shown by the blue line), which is just below the low of the green candle. So if the price broke that low and went lower, it would trigger my sell order and execute.

7) A red Marubozu, sent the price crashing again through all support levels, like it did at 3. I was prepared for a pullback, with my stop loss well above giving sufficient room for pullbacks.

My initial stop loss was at 161, the wall created by price action causing three candles to bounce off. After the big red candle, my stop loss was revised to 159.6, which is just above the mid-line of the red Marubozu.

8) The subsequent candles were not potent enough to break my stop loss, allowing me to stay in the trade. The price did not go above the BB band center line either, MACD was red, sending the price downward, gently.

Exited at 156.5, when the red candle cut the bottom BB line and was followed by a green candle, with a profit of 6%.

10% profit, almost lunch time...closed trading for the day, had a scrumptious lunch and invested my time in other things :thumb:
 

Similar threads