@Tejas Khoday
I have been reporting a bug with your Trading from Charts functionality on FyersWeb (which is your USP as compared to other brokers) since March. But I haven't been able to get anywhere. The impression I have formed is that the Support staff at Fyers is out there to defend their platform and not really listen to customers even in the face of evidence. You have a promising platform but I have had an extremely frustrating experience so far because of the people on your team and the inability of the folks at Fyers to listen to customer feedback.
The issues are fairly straight-forward and glaring.
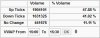
1. Net Avg Price calculation in Dashboard->AllPositions is incorrect. (See attachment for Positions in NTPC.) 200 Sell Qty @ 154.6 and 100 Buy Qty at 155.8; but the Net Avg position is displayed as 100 Sell Qty at Net avg price of 153.4. The correct representation should be Net avg position of 100 Sell Qty at Net avg Price of 154.6
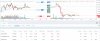
2. The above avg price is also shown in the charts, thus erroneously showing a Open position of 100 Sell Qty at 153.4 with red dotted line. This gives an erroneous representation of open position while trading from charts.
Please ask members on your team to use systems like TradingView (paper trading) or Trade station which have Trading from Chart functionality. After talking to them I get a sense they have never traded in their life using Trading from Charts and hence are unaware. Whats worse is that they are not willing to learn.