


Demand and Supply zone trading
- Thread starter nifty trade
- Start date
For Nifty Future supply area.
Comments are always welcome.....
Comments are always welcome.....
Heres my daily chart.
I don't like gaps,so i have taken the candle opens of next days and made new candles with closes accordingly,
As of today nifty has attacked your supply zone which is my green circle,it is a weak supply zone PA is starting to look bit bullish but i wont look further bullish after dark blue circle,which is also the 50-61 area of last swing down,and obviously the lows below at purple circle will open new bear ground.
In my view it is bearish no highs got broke on daily chart but PA is starting to comply with bulls it can be long on pullback at greenish circle.
More TA study will create more zones,but i think it is beyond the scope of one post.
Will need to make a full video to illustrate that.

Hope this helps.
God bless you.
;-)
Thanks to all for replying.
Short term view for NIFTY SPOT.
If previous supply zone (7491 FUT) taken out then NIFTY SPOT going forward to Daily Supply zone.If not then short bias. If taken out than long on new demand.
Kindly post yours view and comments.
Suggestion are always welcome.
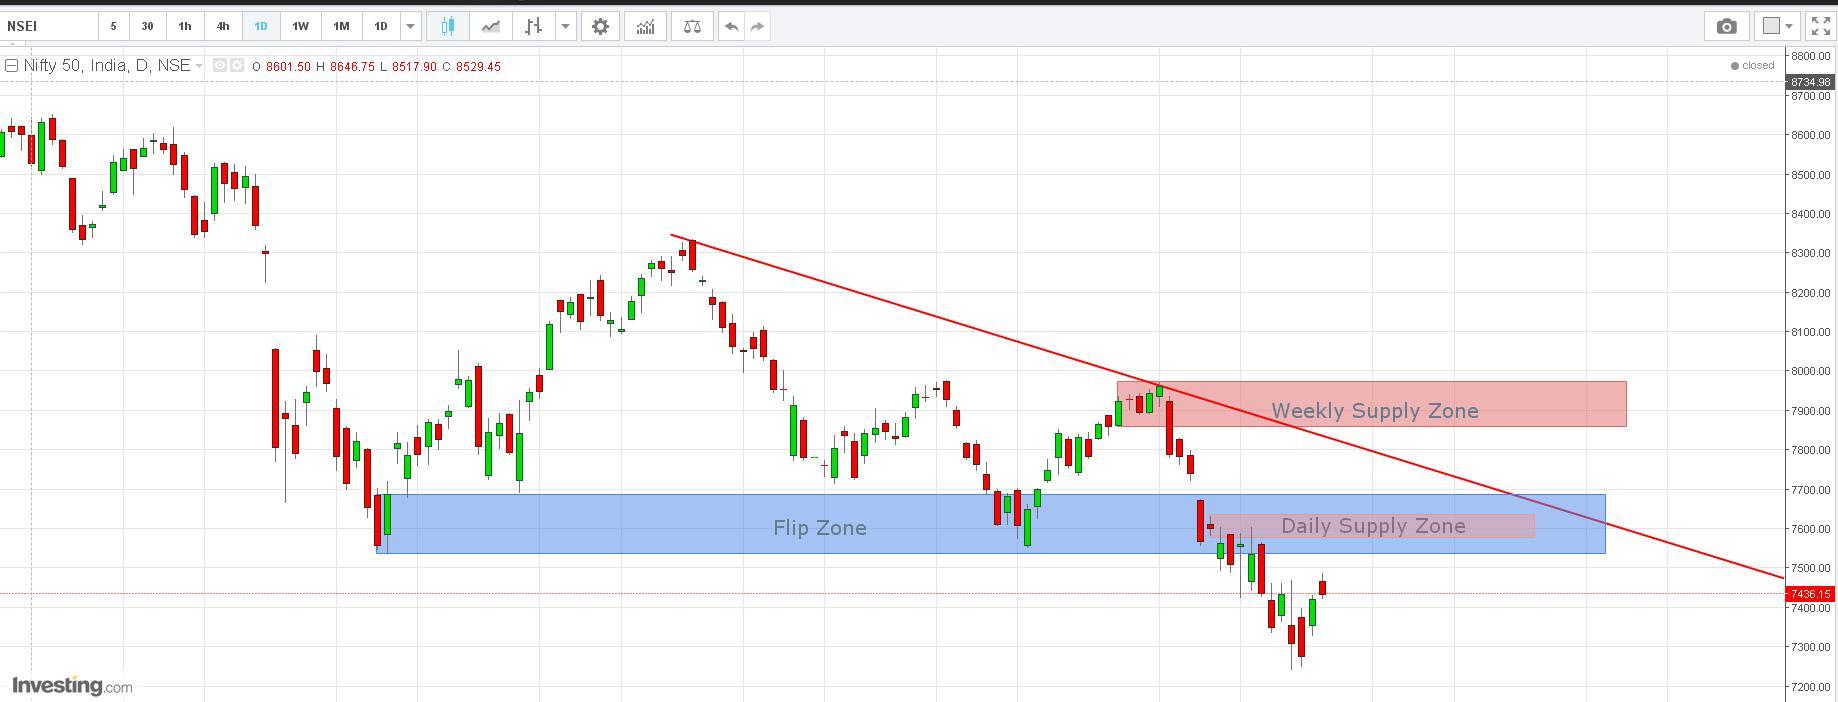
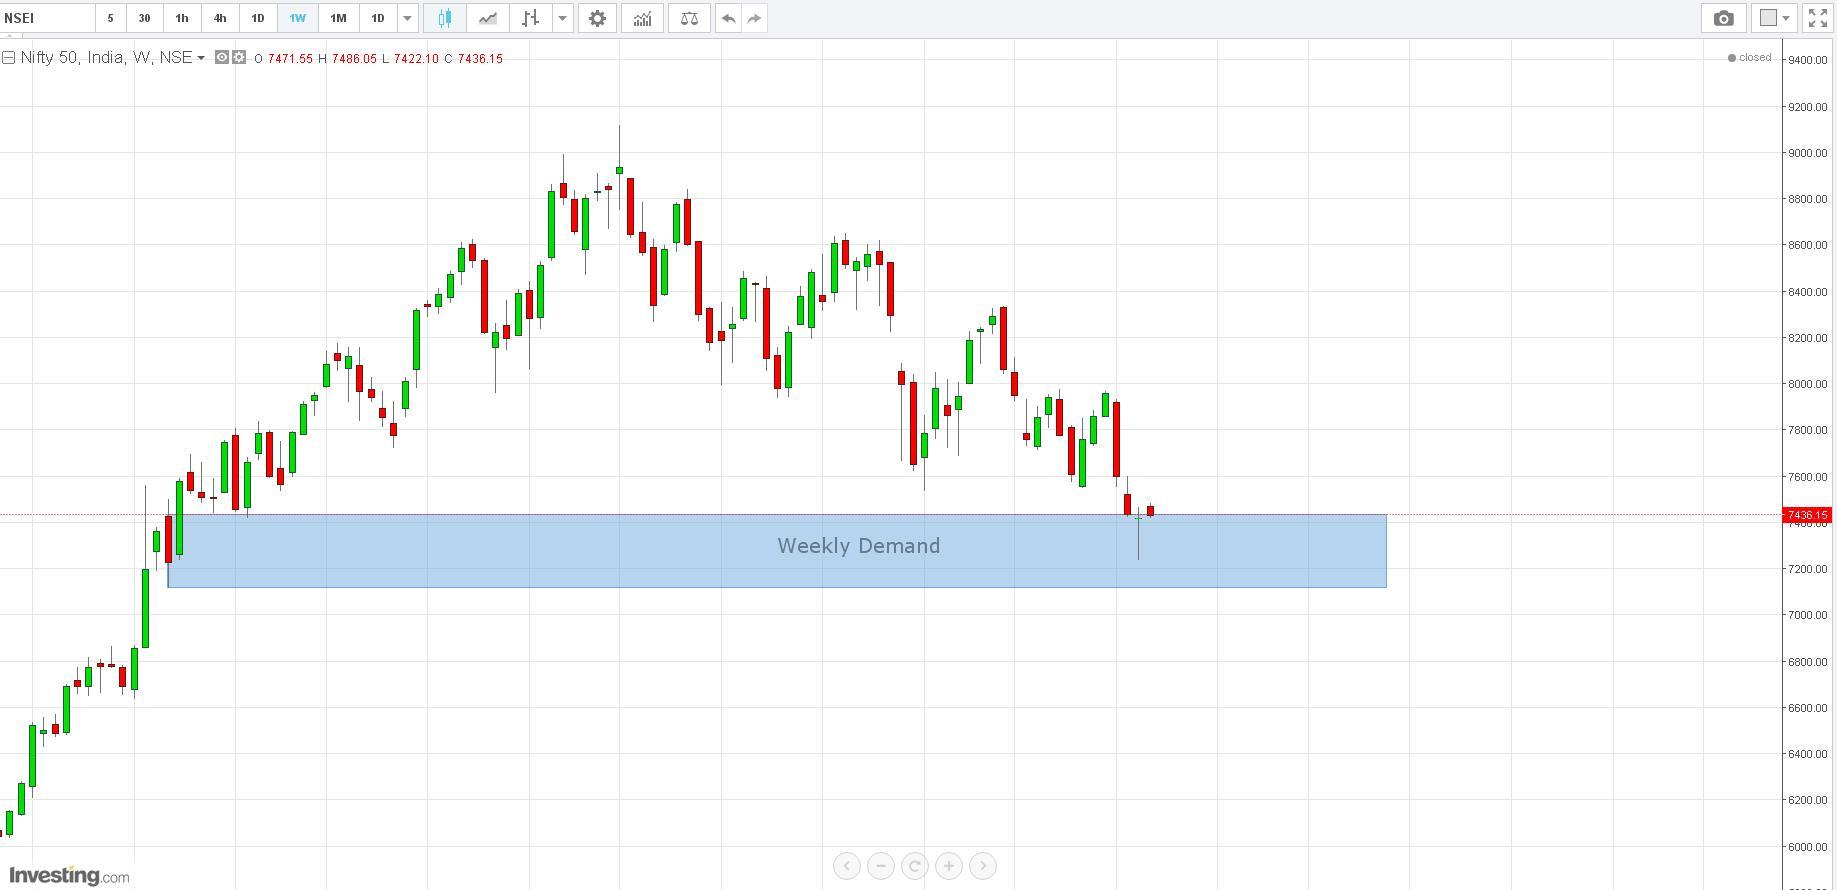
Weekly demand is in control and not violated so NIFTY SPOT reacting weekly level so it should hit daily or weekly supply level.
Short term view for NIFTY SPOT.
If previous supply zone (7491 FUT) taken out then NIFTY SPOT going forward to Daily Supply zone.If not then short bias. If taken out than long on new demand.
Kindly post yours view and comments.
Suggestion are always welcome.
Weekly demand is in control and not violated so NIFTY SPOT reacting weekly level so it should hit daily or weekly supply level.
Last edited:
My Response is a bit late ,by now you may be already trading that zone,but here is my post.
Heres my daily chart.
I don't like gaps,so i have taken the candle opens of next days and made new candles with closes accordingly,
As of today nifty has attacked your supply zone which is my green circle,it is a weak supply zone PA is starting to look bit bullish but i wont look further bullish after dark blue circle,which is also the 50-61 area of last swing down,and obviously the lows below at purple circle will open new bear ground.
In my view it is bearish no highs got broke on daily chart but PA is starting to comply with bulls it can be long on pullback at greenish circle.
More TA study will create more zones,but i think it is beyond the scope of one post.
Will need to make a full video to illustrate that.
Hope this helps.
God bless you.
;-)
Humans being accustomed to associate the cycle of days with opportunities perceive each day as a new opportunity,and with the market they perceive it as the same,so if a last day was trending day in a market(the day being just a session),people tend to become wishful of the market moves that wont materialise.
i mean if you had seen the forex market you would know the cohesion and seperating demarcating lines when market goes into range but in a 6 hour market the ranges just don't sink in well.So people with their mindset of a new day new opportunity,tend to trade the range days thinking of them as a trending day and then loose money.
When in reality one must break down these limited trading hours as sessions of volatility and ranging periods.So when someone trades them 6 hour markets with limited perspective they get trapped in a range .
The best solution i see to resolve this mess is to draw a bigger time frame chart so we only trade in the bigger perspective,as the limited hours of trading can throw in a volatility based session or a range session entirely as price has to fight the S/D zones in its way,having a bigger perspective helps not trade in the noise zone.
So i post an attempt to point out how to build a bigger perspective
S/D zones can not be traded in vaccum,they need a trading plan associated with them.
i will outline the S/D zones along the way,but they will only be outlined and used as mile markers aiding the plan not be used alone.
Nifty did reach the target zone of 7600.
Here is the big top down analysis of nifty,just using simple stuff,Fibs and PA.
yearly and 6 month chart.
Nifty being an index of stocks has been bullish,stock have only one way to go if they are good and that is up.nifty has been in an uptrend on the year to year basis only getting slighly battered during the year 2015,knocking sideways possibly correcting the bull run,the yearly bar shown in the attached chart after the monthly bar show 2015 showing nice pinnish look.The Year 2016 has started with a big red candle in january.The 6 monthly chart(extreme right) of nifty clearly shows a few things the last 6 months in the year 2015 had a hard time breaching the lows of the last 6 monthly bar low of the year 2014,and rose with a wick from there,
Ideally with fast correction the next 6 month period the first 6 months of year 2016 should break the low established by september 2015 the wick of the 6 monthly bar of secnd part of 2015,and should hold below the september 2015 low for a few months.and continue downstairs. for further lows and more correction.
There is a bullish scenerio which might be in play ,in which february month can lay down the foundation for bullish bar on the first 6 monthly chart that can possibly revisit the 8500 area.This scenerio however will be void if the low of january gets break pointing to trading bear only after break of 7250 area.
I favor the bulls as the pullback of 8500 area will be good for a drop during year end 2016 as there is a pinbar on the yearly chart,and there hasn't been enough strong move(no bull bars yet on 6 months or yearly chart) from down stairs to complete the correction we see on the yearly chart.
So favoring bulls is only till they reach the neckline of the pinbar.
This being a technical point of view it hinges on the price,even bigger patters follow techs to some extent but ideally if fundies point the way then nifty nedn't make a pinbar on year 2016 to rise all the way back,it can make a full blown bull bar on the yearly chart.
All thing being said i am favoring the bulls for next 6 months,this is subject to change with the break below the 7250 area ,the break should be visible on the weekly chart.
The fibs drawn on the last swing show that 38.2 fib has been reached,targetting 50 will be a good target to the bear side during latter part of 2016.

The weekly chart:
I am looking at weekly chart in the near term only not too far so only focusing on last 4-5 weekly bars.
The weekly chart shows a few things as below.
I havn't discounted the friday bar which i will discount on monday open in nifty as this friday is entrely fundamental and must have nothing to do with techs,the NFP will be released in US session and NSE will be closed then so no judgements about the close can be made on the weekly chart.
ideally no one should trade the NFP friday as it is pure noise before the release and one cant fix a bias without knowing the close on weekly
There are key areas here on weekly chart that can resist the bullish bias.
The 7400,7600,and 7470-7500.

Bulls remain favored by me because of the reason that january low remains unbroken.
The following image shows what monday can bring for the bulls.
The better close would be in the 7500 area for this weeks bar that could be a good starting point for the bulls to start their attack and approach for the 8500 area.
The ok close could still be 7400 area,that would still be a bullish close.
The worst close is the 7350 that is essentially a bearish engulfing point to low break of january.
The 7400 and 7500 are all confluent with lows and closes that is really funny.
even 7350 is a S2 drawn from standard pivots on weekly chart and is a demand zone on the way down .
even more funny is people complicate stuff the 7600 high was exactly the monthly pivot as per standard pivot formula,pivot had to cause a drop.

The Candle Marked by yellow circle is this weeks candle,depending on where it closes(opens on monday)the trading plan will have to adjust accordingly.
The Candles drawn in dark brow color show what the next weeks candle possible scenerios could become depending on the open there is on monday.

Scenerio 1,3,5,4 are for the bulls.
1 scenerio is if this weeks close is above 7500. then we could see a bull bar till 7600.the trade plan would be break play of 7500,buy every bar that breaks high .
3 and 4 are scenerios for rejection again at the low,then the demand zones any should be watched for buying opportunity.
2 scenerio is bearish selling the 7600 supply zone waiting for range to form at 7600 and let that range break its low.
6,7,8 are bearish scenerios if this week closes at 7400.
scenerios 6 is sell close to 7400 at nearest supply zone.
7 and 8 scenerio are just sell bar breaks down.
It is all about trading according to bigger chart.
So we draw up our bigger time frame analysis then draw possible scenerios then draw the S/D zones then trade off them.
We partially close our positions at the demand zones or supply zones if the plan demands.
Essentially we are looking for entries,with bigger perspective.
We change perspective if chart changes drastically.
We continue following the plan till perspective changes,so if one demand zone fails we try buying lower,till plan changes,
Its all planning your trades and trading your plan.
Hope this helps.
God Bless you.
;-)
Last edited:
There is a certain thing that bugs me about the markets that trade only for a few hours before closing down and opening again,one of them being it creates a misconception about the possible market situations that can arise,for those of the people who have not actually seen the 24 hour market they wont understand but here is my attempt,at explaining the possible problem that i see very clearly staring at me in the face when i think about markets that only trade for a limited amount of time.
Humans being accustomed to associate the cycle of days with opportunities perceive each day as a new opportunity,and with the market they perceive it as the same,so if a last day was trending day in a market(the day being just a session),people tend to become wishful of the market moves that wont materialise.
Humans being accustomed to associate the cycle of days with opportunities perceive each day as a new opportunity,and with the market they perceive it as the same,so if a last day was trending day in a market(the day being just a session),people tend to become wishful of the market moves that wont materialise.
:clapping: Sir all greek and latin to me, have taken printout of the post will repeatedly read it till I can understand it, Thanks for analysis.:thumb::thumb::thumb:
its not market acting wierd it is its way of moving,since people come in with desire to catch a trending day each day,they get caught when price is ranging.
Solution is to know which direction to trade,and position yourself during consolidation days for that 1 trending day,rather then running to catch every 5 min breakout on that trending day.
The reason why the trending days in nifty are ruthless because market opens with intent of resolving that one consolidation that has been happening for hours.
Can't say it more simply.
God Bless you.
;-)
Thanks....
Great insight. :thumb:
Great insight. :thumb:
Market will knock sideways at big areas for hours,since 6 hours are days in nifty,you can see 3-4 days at an area,then the area resolves and you see trending day or just 1-2 trending days.
its not market acting wierd it is its way of moving,since people come in with desire to catch a trending day each day,they get caught when price is ranging.
Solution is to know which direction to trade,and position yourself during consolidation days for that 1 trending day,rather then running to catch every 5 min breakout on that trending day.
The reason why the trending days in nifty are ruthless because market opens with intent of resolving that one consolidation that has been happening for hours.
Can't say it more simply.
God Bless you.
;-)
Similar threads
-
 Advance Price Action Trading with Demand Supply & More
- Started by AlphaT
- Replies: 1,090
-
-
What is quality of base in supply demand trading ? What are the rules ?
- Started by Artatran
- Replies: 0
-
 Demand and Supply trade setup(Day Trading)
- Started by akashsantra
- Replies: 8
-