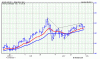
RKK, This is a bearish pattern named by Gartley as butterfly patterns. Ofcourse we have bullish version of this as well. In layman's term, it is combinations of waves that have shown nice fib ratios in their formation.
Here first drop from 1575 or so is wave XA, then you can mark AB, BC, CD waves.
AB wave retraced roughly 0.38 of XA, point D is approximately at 0.76 of XA..
So if these ratios are nicely forming a butterfly shape, then Point D is the entry of a short trade with SLoss above point X.
For more on this, google Gartley patterns / Harmonic patterns / articles by Larry Pesavento.
It is difficult to find bearish call on Gold in current situation, but as a trader shall we listen to media/rumors/Fundamental news etc or believe in our pattern and trade them.
If dollar starts moving up next week, after marking double bottom then we might see next round of drop in commodities and gold may also go with it.
As per my analysis, 1580/ 1600 has been the top of current run for gold and we might be heading for 1450 /1425 level or so.
happy trading.
Happy Trading.


 India Pesticides IPO opens on June 23, 2021.