


Market profile Chart
- Thread starter shruti.trader
- Start date
Posting 2 codes. Check if any of them helps.
Note: One of the codes might have compatibility issues which i have no resolution for. I am not the author.
1st Lite Code:
2nd Bigger Heavy Code -- might have compatibility issues
Note: One of the codes might have compatibility issues which i have no resolution for. I am not the author.
1st Lite Code:
PHP:
// Market Profile AFL V2.0
// Last updated by Vimal([email protected]) on 31/12/2014
// Visual experience optimized for black background. It can also be customized for other backgrounds.
//_SECTION_BEGIN("Price");
//SetChartOptions(0,chartShowArrows|chartShowDates);
//volDiff = ROC( V, 1 );
//_N(titleSpecial = " Vol " + WriteVal( V, 1.0 ) +  WriteIf( volDiff < 0,  EncodeColor( colorRed ), EncodeColor( colorGreen ) ) + " (" + WriteVal( volDiff , 1.1 ) + "%%)" +
//						EncodeColor( colorDefault ) + " \nLot Size = " + EncodeColor( colorYellow ) + WriteVal( RoundLotSize, 1.0 ) );
//_N(Title = StrFormat("{{NAME}} - {{INTERVAL}} {{DATE}} Open %g, Hi %g, Lo %g, Close %g (%.1f%%)" + titleSpecial, O, H, L, C, SelectedValue( ROC( C, 1 ) ) ) );
//Plot( C, "Close", ParamColor("Price Color", colorDefault ), styleNoTitle | ParamStyle("Price Style") | GetPriceStyle(), Null, Null, 0, 0 );
//_SECTION_END();

//_SECTION_BEGIN( "MPLite" );
// - there was a plot limit call introduced after 5.41.0 beta
//   i.e. "•Warning 502: Calling Plot()/PlotOHLC over 500 times is displayed in indicator in runtime to prevent abuse"
// - uses GFX for major calls of plot only if AB version newer than 5.40 - this only delays reaching the plot limit
// - see also the toggle parameter "use_original_version"

use_original_version = ParamToggle("MP version", "GFX code(only if AB > 5.40)|original code", 0);
percent = Param( "Value Area", 70, 1, 100, 1 );
Type = ParamToggle( "Type", "Price Profile|Volume Profile", 0 );
Period = ParamList( "Base", "Hourly|Daily|Weekly|Monthly|Lastthursday|Yearly", 1 );
x_scale = Param( "Horizontal_scale", 1, 0, 10, 0.1 );
EnMP2 = ParamStyle( "Style", styleLine | styleNoLabel, maskAll );

EnIB = ParamToggle( "Show Initial Balance",  "No|Yes", 1 );
IBBars = Param( "Initial Balance Bars", 2, 1, 10, 1 );
ViewYvalues = ParamToggle( "Show Yesterdays Values", "No|Yes", 1 );
ViewVlines = ParamToggle( "Show Vertical Base Lines", "No|Yes", 1 );
Viewvalues = ParamToggle( "Show Values", "No|Yes", 0 );
ViewVpoc = ParamToggle( "Show Virgin POC", "No|Yes", 1 );
ViewTPO = ParamToggle( "Show TPO Count", "No|Yes", 0 );

Color_Above_VA = ParamColor( "Color_Above_VA",  colorTan );
Color_VA = ParamColor( "Color_VA", colorBlueGrey );
Color_Below_VA = ParamColor( "Color_Below_VA", colorTan );
Color_POC_line = ParamColor( "Color_POC_Line", colorYellow );
color_YPOC = ParamColor( "YPOC", colorYellow );
Color_Virgin_POC = ParamColor( "Virgin Poc Color", colorYellow );
Color_Base_Line = ParamColor( "Base Line Color", colorDarkGrey );
Color_YVA = ParamColor( "YVA", colorLightBlue );
Transparency_YVA = Param( "YVA Transparency", 0.6, 0, 1, 0.01 );
Color_IB = ParamColor( "IB Color", colorGrey40 );
Transparency_IB = Param( "IB Transparency", 0.6, 0, 1, 0.01 );
Pen_Thickness = Param( "Line Thickness", 1, 1, 2 );

function Lastthursday() {
	Daysinmonth = IIf( Month() == 1 OR Month() == 3 OR Month() == 5 OR Month() == 7 OR Month() == 8 OR Month() == 10 OR Month() == 12, 31, 30 );
	Daysinmonthfeb = IIf( Year() % 4 == 0 AND Year() % 100 != 0, 29, 28 );
	Daysinmonthfinal = IIf( Month() == 2, Daysinmonthfeb, Daysinmonth );
	returnvalue = IIf( Daysinmonthfinal - Day() < 7 AND DayOfWeek() == 4, 1, IIf( Daysinmonthfinal - Day() < 8 AND DayOfWeek() == 3 AND Ref( DayOfWeek(), 1 ) != 4 AND Day() != Daysinmonthfinal , 1, 0 ) );
	return returnvalue;
}

procedure PlotlinewithGFXinit() {
	global AB_Miny, AB_Maxy, AB_lvb, AB_fvb;
	global AB_pxchartleft, AB_pxchartwidth, AB_pxchartbottom, AB_pxchartheight;
	global AB_TotalBars, AB_penwidth;

	RequestTimedRefresh(1);
	GfxSetOverlayMode( 0 );
	AB_penwidth = Pen_Thickness;

	AB_Miny = Status( "axisminy" );
	AB_Maxy = Status( "axismaxy" );
	AB_lvb = Status( "lastvisiblebar" );
	AB_fvb = Status( "firstvisiblebar" );

	AB_pxchartleft = Status( "pxchartleft" );
	AB_pxchartwidth = Status( "pxchartwidth" );
	AB_pxchartbottom = Status( "pxchartbottom" );
	AB_pxchartheight = Status( "pxchartheight" );

	AB_TotalBars = AB_Lvb - AB_fvb;
}

procedure Plot_horizon_line_with_GFX( ix0, ix1, iy, icolor ) {
	global AB_Miny, AB_Maxy, AB_lvb, AB_fvb;
	global AB_pxchartleft, AB_pxchartwidth, AB_pxchartbottom, AB_pxchartheight;
	global AB_TotalBars, AB_penwidth;

	local ix0, ix1, iy, icolor;
	local x_px, y_px, y_scale;

	GfxSelectPen( icolor, AB_penwidth, 0 );
	x_px = AB_pxchartleft + ( ix0 - AB_fvb ) * AB_pxchartwidth / ( AB_TotalBars + 1 );

	y_scale = AB_pxchartheight / ( AB_maxy - AB_miny );
	y_px = AB_pxchartbottom - floor( 0.5 + ( iy  - AB_Miny ) * y_scale );
	GfxMoveTo( x_px, y_px );

	x_px = AB_pxchartleft + ( ix1 - AB_fvb ) * AB_pxchartwidth / ( AB_TotalBars + 1 );
	GfxLineTo( x_px, y_px );
}

FirstVisibleBar = Status( "FirstVisibleBar" );
Lastvisiblebar = Status( "LastVisibleBar" );
totalVisible = Lastvisiblebar - FirstVisibleBar;

if ( Period == "Hourly" ) {
	BarsInDay = BarsSince( Hour() != Ref( Hour(), -1 ) );
	Bot = TimeFrameGetPrice( "L", inHourly, 0 );
	Top = TimeFrameGetPrice( "H", inHourly, 0 );
	Vol = TimeFrameGetPrice( "V", inHourly, 0 );
}

if ( Period == "Daily" ) {
	BarsInDay = BarsSince( Day() != Ref( Day(), -1 ) ) ;
	Bot = TimeFrameGetPrice( "L", inDaily, 0 );
	Top = TimeFrameGetPrice( "H", inDaily, 0 );
	Vol = TimeFrameGetPrice( "V", inDaily, 0 );
}

if ( Period == "Weekly" ) {
	BarsInDay = BarsSince( DayOfWeek() < Ref( DayOfWeek(), -1 ) );
	bot1 = ValueWhen( BarsInDay == 0, L, 1 );
	bot2 = ValueWhen( Ref( BarsInDay, 1 ) == 1 OR BarIndex() > BarCount - 2 , LLV( L, BarsInDay ), 0 );
	bot = Min( bot1, bot2 );
	top1 = ValueWhen( BarsInDay == 0, H, 1 );
	top2 = ValueWhen( Ref( BarsInDay, 1 ) == 1 OR BarIndex() > BarCount - 2, HHV( H, BarsInDay ), 0 );
	top = Max( top1, top2 );
	Vol = TimeFrameGetPrice( "V", inWeekly, 0 );
}

if ( Period == "Monthly"  OR Interval() == inDaily ) {
	BarsInDay = BarsSince( Month() != Ref( Month(), -1 ) );
	Bot = TimeFrameGetPrice( "L", inMonthly, 0 );
	Top = TimeFrameGetPrice( "H", inMonthly, 0 );
	Vol = TimeFrameGetPrice( "V", inMonthly, 0 );
}

if ( Period == "Lastthursday" ) {
	BarsInDay = BarsSince( Lastthursday() == 0 AND Ref( Lastthursday(), -1 ) == 1 );
	bot1 = ValueWhen( BarsInDay == 0, L, 1 );
	bot2 = ValueWhen( Ref( BarsInDay, 1 ) == 1 OR BarIndex() > BarCount - 2 , LLV( L, BarsInDay ), 0 );
	bot = Min( bot1, bot2 );
	top1 = ValueWhen( BarsInDay == 0, H, 1 );
	top2 = ValueWhen( Ref( BarsInDay, 1 ) == 1 OR BarIndex() > BarCount - 2, HHV( H, BarsInDay ), 0 );
	top = Max( top1, top2 );
	Vol = ValueWhen( Ref( BarsInDay, 1 ) == 1 OR BarIndex() > BarCount - 2 , Sum( V, BarsInDay ), 0 );
}

if ( Period == "Yearly" OR Interval() == inWeekly ) {
	BarsInDay = BarsSince( Year() != Ref( Year(), -1 ) );
	Bot = TimeFrameGetPrice( "L", inYearly, 0 );
	Top = TimeFrameGetPrice( "H", inYearly, 0 );
	Vol = TimeFrameGetPrice( "V", inYearly, 0 );
}

CurTop = HHV( H, BarsInDay + 1 );
Curbot = LLV( L, BarsInDay + 1 );
Range =  Top - Bot;
coverage = LastValue( Ref( ATR( 10 ), -1 ) );

den = ( coverage / 10 );

multiplier = IIf( round( totalVisible ) / 300 < 1, 1, round( totalVisible ) / 300 );

if ( ViewVlines == 1 ) {
	Plot( BarsInDay == 0, "", Color_Base_Line, styleHistogram | styleOwnScale | styleLine | styleNoLabel );
}

relTodayRange = 0;

x = 0;
basey = 0;
basex = 0;
newday = 0;
total = 0;
shiftup = 0;
shiftdn = 0;
Line = Null;
Voloumeunit = 0;

PlotlinewithGFXinit();
for (  i = IIf( FirstVisibleBar - 100 > 1, FirstVisibleBar - 100, FirstVisibleBar ); i < Lastvisiblebar AND i < BarCount - 1 ; i++  ) {
	if ( BarsInDay[i] == 0 ) {
		t = BarsInDay[i-1];
		if ( EnIB == 1 ) {
			IBH = HHV( H, IBBars );
			IBL = LLV( L, IBBars );
			Line1 = LineArray( basex , IBH[basex+IBBars-1], i, IBH[basex+IBBars-1] );
			Line2 = LineArray( basex , IBL[basex+IBBars-1], i, IBL[basex+IBBars-1] );
			PlotOHLC( Line1, Line1, Line2, Line2, "", ColorBlend( Color_IB, GetChartBkColor(), Transparency_IB ), styleNoLabel | styleCloud | styleNoRescale, Null, Null, 0, -1 );
		}

		poc = 0;
		pocj = 0;
		midrange = int( relTodayRange / 2 ) + 1;

		for ( j = 1; j <= relTodayRange + 1 ; j++ ) {
			if ( poc < x[j] ) {
				poc = x[j];
				pocj = j;
			}
			else if ( poc == x[j] ) {
				if ( abs( midrange - j ) < abs( midrange - pocj ) ) {
					poc = x[j];
					pocj = j;
				}
			}
		}

		for ( n = 1; n <= relTodayRange; n++ ) {
			total[n] = x[n] + total[n-1];
		}

		Value_area = ( total[relTodayRange] * percent ) / 100;

		for ( a = 1; a <= relTodayRange; a++ ) {
			if ( pocj - a > 0 AND pocj + a < relTodayRange ) {
				if ( poc + total[pocj+a] - total[pocj] + ( total[pocj] - poc ) - total[pocj-( a+1 )] >= Value_area ) {
					shiftup = a;
					shiftdn = a;
					break;
				}
			}
			else if ( pocj - a < 1 ) {
				if ( poc + total[pocj+a] - total[pocj] + ( total[pocj] - poc ) >= Value_area ) {
					shiftup = a;
					shiftdn = pocj;
					break;
				}
			}
			else if ( pocj + a > relTodayRange ) {
				if ( poc + total[relTodayRange] - total[pocj] + ( total[pocj] - poc ) - total[pocj-( a+1 )] >= Value_area ) {
					shiftup = floor( relTodayRange ) - pocj;
					shiftdn = a + 1;
					break;
				}
			}
		}

		if ( ViewVpoc == 1 ) {
			Virginpoc = basey + pocj * den;
			newi = Null;

			for ( j = i; j <= ( BarCount - 1 ) ; j++ ) {
				if ( L[j] < Virginpoc AND H[j] > Virginpoc ) {
					newi = j;
					break;
				}
				else {
					newi = BarCount;
				}
			}
			Plot( LineArray( basex[i], basey + pocj*den, newi, basey + pocj*den ), "", Color_Virgin_POC, styleLine | styleNoRescale );
		}

		Vah = LineArray( baseX[i], baseY + ( pocj + shiftup ) * den, i, baseY + ( pocj + shiftup ) * den );
		Val = LineArray( baseX[i], baseY + ( pocj - shiftdn ) * den, i, baseY + ( pocj - shiftdn ) * den );
		pocline = LineArray( basex, basey + pocj * den, basex[i] + poc, basey + pocj * den );

		Vahn = LineArray( i, baseY + ( pocj + shiftup ) * den, i + t , baseY + ( pocj + shiftup ) * den );
		pocn = LineArray( i, baseY + ( pocj ) * den, i + t, baseY + ( pocj ) * den );
		Valn = LineArray( i, baseY + ( pocj - shiftdn ) * den, i + t , baseY + ( pocj - shiftdn ) * den );

		if ( Version() > 5.4 && !use_original_version ) { // pocline
			Plot_horizon_line_with_GFX( baseX, basex[i] + poc, basey + pocj * den, Color_POC_Line );
		}
		else  {
			Plot( pocline, "", Color_POC_Line, styleLine | styleNoRescale | styleNoLabel );
		}

		if ( ViewYvalues == 1 ) {
			Plot( pocn, "", color_YPOC, styleDashed | styleNoRescale );
			PlotOHLC( Vahn, Vahn, Valn, Valn, "", ColorBlend( color_YVA, GetChartBkColor(), Transparency_YVA ), styleNoLabel | styleCloud | styleNoRescale, Null, Null, 0, -1 );

		}

		if ( ViewTPO == 1 ) {
			nnn = HHV( H, BarsInDay );
			PlotText( "" + ( total[relTodayRange] - total[pocj] ), basex[i], nnn[i], colorLightGrey );
			PlotText( "" + ( total[pocj-1] ), basex[i], basey - den, colorLightGrey );
		}

		if ( Viewvalues == 1 ) {
			PlotText( "" + round( ( basey + pocj*den ) ), baseX[i], basey + pocj*den, colorWhite, colorDarkGrey );
			PlotText( "" + round( ( baseY + ( pocj + shiftup )*den ) ), baseX[i], baseY + ( pocj + shiftup )*den, colorWhite, colorDarkGrey );
			PlotText( "" + round( ( baseY + ( pocj - shiftdn )*den ) ), baseX[i], baseY + ( pocj - shiftdn )*den, colorWhite, colorDarkGrey );
		}

		if ( Version() > 5.4 && !use_original_version ) {
			for ( p = 0; p <= relTodayRange + 1; p = p + multiplier ) {
				Plot_horizon_line_with_GFX( baseX, baseX + x[p], baseY + p * Den, IIf( p > ( pocj + shiftup ), Color_Above_VA, IIf( p <= ( pocj + shiftup ) AND p >= ( pocj - shiftdn ), IIf( x[p]-x_scale < 1, colorRed, Color_VA), Color_Below_VA )));
			}
		}
		else {
			for ( p = 0; p <= relTodayRange + 1; p = p + multiplier ) {
				if ( P > 0 ) {
					line = LineArray( baseX, baseY + ( p ) * Den, baseX + x[p], baseY + ( p ) * Den );
				}
				Plot( line, "", IIf( p > ( pocj + shiftup ), Color_Above_VA, IIf( p <= ( pocj + shiftup )AND p >= ( pocj - shiftdn ), Color_VA, Color_Below_VA ) ) , EnMP2 );
			}
		}

		///////////////////
		basex = 0;
		x = 0;
		Basex = i;
		baseY = Bot[i];
		relTodayRange = Range[i] / Den;
		Voloumeunit = Vol[i] / LastValue( BarsInDay );
	}

	for ( j = 0; j <= relTodayRange ; j++ ) {
		if ( L[i] <= Bot[i] + j*Den AND H[i] >= Bot[i] + j*Den  ) {
			if ( Type == 0 ) { // Price Profile
				x[j] = ( x[j] ) + x_scale;
			}
			else if ( Type == 1 ) { // Volume Profile
				x[j] = x[j] + round( V[i] / Voloumeunit ) + 1;
			}
		}
	}
}

if ( EnIB == 1 ) { // Initial Balance
	IBH = HHV( H, IBBars );
	IBL = LLV( L, IBBars );
	Line1 = LineArray( basex - 20, IBH[basex+IBBars-1], i, IBH[basex+IBBars-1] );
	Line2 = LineArray( basex - 20 , IBL[basex+IBBars-1], i, IBL[basex+IBBars-1] );
	PlotOHLC( Line1, Line1, Line2, Line2, "", ColorBlend( Color_IB, GetChartBkColor(), Transparency_IB ), styleNoLabel | styleCloud | styleNoRescale, Null, Null, 20, -1 );
}

//////////////////////////////////
poc = 0;
pocj = 0;
midrange = int( relTodayRange / 2 ) + 1;

for ( j = 1; j <= relTodayRange + 1 ; j++ ) {
	if ( poc < x[j] ) {
		poc = x[j];
		pocj = j;
	}
	else if ( poc == x[j] ) {
		if ( abs( midrange - j ) < abs( midrange - pocj ) ) {
			poc = x[j];
			pocj = j;
		}
	}
}

for ( n = 1; n <= relTodayRange; n++ ) {
	total[n] = x[n] + total[n-1];
}

Value_area = ( total[relTodayRange] * percent ) / 100;

for ( a = 1; a <= relTodayRange; a++ ) {
	if ( pocj - a > 0 AND pocj + a < relTodayRange ) {
		if ( poc + total[pocj+a] - total[pocj] + ( total[pocj] - poc ) - total[pocj-( a+1 )] >= Value_area ) {
			shiftup = a;
			shiftdn = a;
			break;
		}
	}
	else if ( pocj - a < 1 ) {
		if ( poc + total[pocj+a] - total[pocj] + ( total[pocj] - poc ) >= Value_area ) {
			shiftup = a;
			shiftdn = pocj;
			break;
		}
	}
	else if ( pocj + a > relTodayRange ) {
		if ( poc + total[relTodayRange] - total[pocj] + ( total[pocj] - poc ) - total[pocj-( a+1 )] >= Value_area ) {
			shiftup = floor( relTodayRange ) - pocj;
			shiftdn = a + 1;
			break;
		}
	}
}

Vah = LineArray( baseX[i], baseY + ( pocj + shiftup ) * den, i, baseY + ( pocj + shiftup ) * den );
Val = LineArray( baseX[i], baseY + ( pocj - shiftdn ) * den, i, baseY + ( pocj - shiftdn ) * den );
pocline = LineArray( basex, basey + pocj * den, basex[i] + poc, basey + pocj * den );

if ( ViewTPO == 1 ) {
	PlotText( "" + ( total[relTodayRange] - total[pocj] ), basex[i], top[i], colorLightGrey );
	PlotText( "" + ( total[pocj-1] + x_scale ), basex[i], basey - den, colorLightGrey );
}

if ( Viewvalues == 1 ) {
	PlotText( "" + round( ( basey + pocj*den ) ), baseX[i], basey + pocj*den, colorWhite, colorDarkGrey );
	PlotText( "" + round( ( baseY + ( pocj + shiftup )*den ) ), baseX[i], baseY + ( pocj + shiftup )*den, colorWhite, colorDarkGrey );
	PlotText( "" + round( ( baseY + ( pocj - shiftdn )*den ) ), baseX[i], baseY + ( pocj - shiftdn )*den, colorWhite, colorDarkGrey );
}

if ( Version() > 5.4 && !use_original_version ) {
	for ( p = 0; p <= relTodayRange + 1; p = p + multiplier ) {
		Plot_horizon_line_with_GFX( baseX, baseX + x[p], baseY + p * Den, IIf( p > ( pocj + shiftup ), Color_Above_VA, IIf( p <= ( pocj + shiftup ) AND p >= ( pocj - shiftdn ), Color_VA, Color_Below_VA )));
	}
	// pocline
	Plot_horizon_line_with_GFX( baseX, basex[i] + poc, basey + pocj * den, Color_POC_Line );
}
else {
	for ( p = 0; p <= relTodayRange + 1; p = p + multiplier ) {
		line = LineArray( baseX, baseY + p * Den, baseX + x[p], baseY + p * Den );
		Plot( line, "", IIf( p > ( pocj + shiftup ), Color_Above_VA, IIf( p <= ( pocj + shiftup )AND p >= ( pocj - shiftdn ), IIf( x[p]-x_scale < 1, colorRed, colorBlueGrey), Color_Below_VA ) ), EnMP2 );
	}
    Plot( pocline, "", Color_POC_Line, styleLine | styleNoRescale | styleNoLabel, Null, Null, 0 );
}
//_SECTION_END();
2nd Bigger Heavy Code -- might have compatibility issues
PHP:
_SECTION_BEGIN("VOLUME_Hight of Volume Bars Control");


PlotVOL = ParamToggle( "plot Volume?","No| Yes",1);

VolColor = (C>O OR (C==O AND (H-C)<=(C-L) ))*ParamColor( "VUpColor" ,5) +

(C<O OR (C==O AND
(H-C)>(C-L)) )*ParamColor( "VDnColor" ,4) ;

VolScale = Param("1/Vol. Height (TimeBar chart)(fraction of
window) 5=1/5=20%",10, 2, 100, 1.0) ; // Timebars

if (PlotVOL >0)

{

Vheight = VolScale;

Plot(Prec(Volume ,0),"V",VolColor,
//styleNoTitle| styleOwnScale| styleNoLabel| styleThick| (styleCandle| styleNoLabel) ,Vheight ); }
//Plot(MA(Volume,50),"",colorLightBlue,styleLine);

styleNoTitle| styleOwnScale| styleNoLabel| styleThick| ParamStyle( "VStyle", styleHistogram,maskHistogram| styleNoLabel) ,Vheight ); }
//Plot(MA(Volume,50),"",colorLightBlue,styleLine);


_SECTION_END();

_SECTION_BEGIN("Volume At Price");
PlotVAPOverlay(Param("lines", 1000, 100, 1000, 10), Param("Width", 30, 1, 100, 1), ParamColor("Color", colorBlue), ParamToggle("Side", "Left|Right", 1) | 4 *ParamToggle("Z-order", "On top|Behind", 0));

_SECTION_END();

_SECTION_BEGIN("MarketProfile");
//------------------------------------------------------------------------------
//
// Formula Name: Market Profile
//
// Use with 5/15min chart
// Originial - From AFL library

//Market Profile 9/19/2009

PlotOHLC(O,H,L,C,"Price",IIf(C>O,colorGreen,colorDarkRed),styleCandle);

SetChartBkColor(ParamColor("Outer Panel",colorPaleBlue));
SetChartBkGradientFill(ParamColor("Upper Chart",1),ParamColor("Lower Chart",23));


EnMP2= ParamList("MarketProfile","Solid|Lines|Letters");
styleLines = ParamStyle("Style", styleLine, maskAll);

Type=ParamList("Type","Price Profile|Volume Profile");
Period= ParamList("Base","Hourly|Daily|Weekly|Monthly",1);

Den = Param("Density", 1, 0.25, 100, 0.25); // Resolution in terms of $
percent=Param("Value Area", 70, 1, 100, 1);
ViewTPOCount= ParamToggle("Show TPO Count", "No|Yes",1);
Viewvalues= ParamToggle("Show Values", "No|Yes",1);

ViewPOC = ParamToggle("Show POC", "No|Yes",1);
ViewVALVAH = ParamToggle("Show VAL VAH Line", "No|Yes",1);
Viewfill = ParamToggle("Show VA Fill", "No|Yes",1);
Colorpoc=ParamColor("Color POC", colorYellow);
Colorfill=ParamColor("Color Fill", ColorRGB(20,40,60));


EnIB = ParamToggle("Show Initial Balance", "Yes|No");
IBBars = Param("Initial Balance Bars", 2, 0, 10, 1);

if(Period=="Daily"){
BarsInDay = BarsSince(Day() != Ref(Day(), -1));
Bot = TimeFrameGetPrice("L", inDaily, 0);
Top = TimeFrameGetPrice("H", inDaily, 0);
Vol = TimeFrameGetPrice("V", inDaily, 0);
}

if(Period=="Hourly"){
BarsInDay = BarsSince(Minute() != Ref(Minute(), -1));
Bot = TimeFrameGetPrice("L", in5Minute, 0);
Top = TimeFrameGetPrice("H", in5Minute, 0);
Vol = TimeFrameGetPrice("V", in5Minute, 0);
}

if(Period=="Weekly"){
BarsInDay = BarsSince(DayOfWeek() < Ref( DayOfWeek(), -1 ));
Bot = TimeFrameGetPrice("L", inWeekly, 0);
Top = TimeFrameGetPrice("H", inWeekly, 0);
Vol = TimeFrameGetPrice("V", inWeekly, 0);
}

if(Period=="Monthly" ){
BarsInDay = BarsSince(Month() != Ref(Month(), -1));
Bot = TimeFrameGetPrice("L", inMonthly, 0);
Top = TimeFrameGetPrice("H", inMonthly, 0);
Vol = TimeFrameGetPrice("V", inMonthly, 0);
}

CurTop = HHV(H,BarsInDay+1);
Curbot = LLV(L,BarsInDay+1);
Range = Highest(Top-Bot);
TodayRange = Top - Bot;

AveRange = Sum(Top-Bot,30)/30;
LAveRange = AveRange[BarCount-1];

// Initialization
baseX = 0;
baseY = floor(Bot[0]/Den)*Den;
relTodayRange = 0;
firstVisBar = Status("firstvisiblebar");
lastVisBar = Status("lastvisiblebar");

D=.0005;
total=0;
totaldn=0;
totalup=0;
shiftup=0;
shiftdn=0;
startr=0;

for (j=0; j <= 100; j++) {
x[j] = 0;
}

i0 = 0;
i1 = 0;
for (i=0; i<BarCount; i++) {
if (BarsInDay[i] == 0 AND i < firstVisBar) {
i0 = i;
}
if (BarsInDay[i] == 0 AND i >= lastVisBar) {
i1 = i;
}
}

i1 = BarCount-1;
for (i=i0; i<=i1; i++) {
if (BarsInDay[i] == 0) {
baseX = i;
baseY = floor(Bot[i]/Den)*Den;
maxY = floor(Top[i]/Den)*Den;
relTodayRange = (maxY-baseY)/Den;

for (j=0; j <= relTodayRange; j++) {
x[j] = 0;
}
}

range_x=lastVisBar-firstVisBar;
spread = Param("X Space", 80, 1, 200, 1);
tpl = Param("Time Per Letter (mins)", 30, 1, 360, 1);
Intervalmin=Interval()/60;
flt =Param("First Letter (Bars)", 1, 1, 60, 1);
teb=ParamToggle("To Each Bar","No|Yes");
Color=Param("Color Threshold",20,1,50,1);
stopg=0;
stopr=0;
new=0;

Voloumeunit=Vol[i]/LastValue(BarsInDay);


if (EnMP2 == "Letters") {
for (j=0; j<= relTodayRange; j++) {
if (L[i] <= baseY+j*Den AND H[i] >= baseY+j*Den) {
PlotText(StrExtract(" A , B , C , D , E , F , G , H , I , J , K , L , M , N , O , P , Q , R , S , T , U , V , W , X , Y , Z, a , b , c , d , e , f , g , h , i , j , k , L , m , n ,o , p , q , r , s , t , u , v , w , x , y , z ",
IIf(BarsInDay[i]<flt,0,ceil(BarsInDay[i]/(tpl/Intervalmin))-0)), baseX+IIf(teb==1,BarsInDay[i],x[j]*(range_x/spread)), baseY+j*Den,
colorWhite,ColorHSB(10+((ceil(BarsInDay[i]/(tpl/Intervalmin)))*Color),160,140));
x[j]++;

}
}
}

else if (EnMP2 == "Lines" OR EnMP2 == "Solid") {
for (j=0; j<= relTodayRange; j++) {
if (L[i] <= baseY+j*Den AND H[i] >= baseY+j*Den) {
if(Type=="Price Profile"){x[j]=x[j]+1;}
else if(Type=="Volume Profile"){x[j]=x[j]+round(V[i]/Voloumeunit);}

}
}
}

// Draw Initial Balance after 11am bar is complete
if (BarsInDay[i] == IBBars+1 AND EnIB == 0) {
Line1 = LineArray(i-2, curtop[i-1],i+7, curtop[i-1],0,True);
Plot(Line1,"",colorLightGrey,styleLine+styleDashed|styleNoRescale);
Line1 = LineArray(i-2, curbot[i-1],i+7, curbot[i-1],0,True);
Plot(Line1,"",colorLightGrey,styleLine+styleDashed|styleNoRescale);
}

// Examine x[j]
if ((i < BarCount - 1 AND BarsInDay[i+1] == 0) OR i == BarCount-1) {
maxXj = 0;
maxj = 0;
midrange = int(relTodayRange/2)+1;
for (j=0; j<= relTodayRange; j++) {
if (maxXj < x[j]) {
maxXj = x[j]; maxj = j; StaticVarSet("Maxj",j); new=j;
} else if ( MaxXj == x[j]) {
if (abs(midrange-j) < abs(midrange-StaticVarGet("Maxj"))) {
maxXj = x[j]; maxj = j; StaticVarSet("Maxj",j); new=j;
}
}
}
for ( n = 1; n <= relTodayRange; n++ ) {
total[n]=x[n]+total[n-1];
}
Value_area=(total[relTodayRange]*percent)/100;

for ( a = 1; a <= relTodayRange; a++ )
{
if(Maxj-a>0 AND Maxj+a<relTodayRange)
{
if(MaxXj+total[Maxj+a]-total[Maxj]+(total[maxj]-MaxXj)-total[Maxj-(a+1)]>=Value_area) {shiftup=a; shiftdn=a; break;}
}
else if(Maxj-a<1 )
{
if(MaxXj+total[Maxj+a]-total[Maxj]+(total[maxj]-MaxXj)>=Value_area){shiftup=a; shiftdn=maxj-1; break;}
}
else if(Maxj+a>relTodayRange )
{
if(MaxXj+total[relTodayRange]-total[Maxj]+(total[maxj]-MaxXj)-total[Maxj-(a+1)] >=Value_area){shiftup=relTodayRange-maxj; shiftdn=a; break;}
}
}

Vah = LineArray(baseX, baseY+(maxj+shiftup)*Den, i, baseY+(maxj+shiftup)*Den,0,True);
Val = LineArray(baseX, baseY+(maxj-shiftdn)*Den, i, baseY+(maxj-shiftdn)*Den,0,True);
poc = LineArray(baseX, baseY+maxj*Den, i, baseY+maxj*Den,0,True);
if(ViewVALVAH==1){Plot(Vah,"",ParamColor("Color_VA", colorBlueGrey),styleLine|styleNoRescale);
Plot(Val,"",ParamColor("Color_VA", colorLightBlue),styleLine|styleNoRescale);}
if(ViewPOC==1){Plot(poc,"",Colorpoc,styleLine|styleNoRescale);}
if(Viewvalues==1){PlotText(""+(baseY+(maxj+shiftup)*Den),i-5,baseY+(maxj+shiftup)*Den,colorWhite);
PlotText(""+(baseY+(maxj-shiftdn)*Den),i-5,baseY+(maxj-shiftdn)*Den,colorWhite);
if(ViewTPOCount==1){PlotText(""+(total[maxj]-MaxXj)+" / "+(total[maxj-shiftdn+1]),basex,bot[i]-(Top[i]-bot[i])*0.05,ParamColor("Color_Below_VA", colorGrey40));
PlotText(""+(total[relTodayRange]-total[maxj])+" / "+(total[relTodayRange]-total[maxj+shiftup]),basex,Top[i],ParamColor("Color_Above_VA", colorGrey40));
}


if(ViewPOC==1){PlotText(""+(baseY+maxj*Den),i-5,baseY+maxj*Den,Colorpoc);}}
}

if (i < BarCount - 1 AND BarsInDay[i+1] == 0 OR i == BarCount-1) {

for (p = 1; p < relTodayRange+1; p++){
line = LineArray(baseX, baseY+p*Den, baseX+x[p], baseY+p*Den);
line2 = LineArray(baseX, baseY+(p-1)*Den, baseX+x[p-1], baseY+(p-1)*Den);

if (EnMP2 == "Solid")
{
PlotOHLC( Line, Line, Line2, Line2, "",IIf(p>(maxj+shiftup),ParamColor("Color_Above_VA", colorGrey40),IIf(p<=(maxj+shiftup)AND p>(maxj-shiftdn),ParamColor("Color_VA", colorBlueGrey),ParamColor("Color_Below_VA", colorGrey40))) ,styleCloud|styleNoRescale|styleNoLabel);
}
if (EnMP2 == "Lines")
{
Plot(line,"",IIf(p>(maxj+shiftup),ParamColor("Color_Above_VA", colorGrey40),IIf(p<=(maxj+shiftup)AND p>(maxj-shiftdn),ParamColor("Color_VA", colorBlueGrey),ParamColor("Color_Below_VA", colorGrey40))) , styleLines|styleNoLabel);
}

}
if(Viewfill==1){PlotOHLC(Vah,Vah,Val,Val,"",Colorfill,styleCloud|styleNoRescale|styleNoLabel);}

}
}


_SECTION_END();
//==============================

DayH = TimeFrameGetPrice("H", inDaily, -1);// yesterdays high
DayL = TimeFrameGetPrice("L", inDaily, -1);//low
DayC = TimeFrameGetPrice("C", inDaily, -1);//close
DayO = TimeFrameGetPrice("O", inDaily);// current day open
HiDay = TimeFrameGetPrice("H", inDaily);
LoDay = TimeFrameGetPrice("L", inDaily);


Title =   Name() + " - " + EncodeColor(colorRed)+ Interval(2) + EncodeColor(colorWhite) +
 "  - " + Date() +" - "

+ "Vol= "+ WriteVal(V) +WriteIf ( V > MA(V,26) ,EncodeColor(colorGreen)+"  UP "+ (V/MA(V,26))*100 + " %", EncodeColor(colorRed)+"  DOWN "+ (V/MA(V,26))*100 + " %")+ EncodeColor(colorLightBlue)
+ EncodeColor(colorYellow)+   " Yesterday's High : "+ EncodeColor(colorWhite)+DayH + EncodeColor(colorYellow)+   "    Yesterday's Low : "+ EncodeColor(colorWhite)+DayL

+ EncodeColor(colorBrightGreen)+   "\n                  Hi: "+ EncodeColor(colorWhite)+H


+ EncodeColor(colorYellow)+   "\n       Op: "+ EncodeColor(colorWhite)+O+ EncodeColor(colorAqua)+   "   Cl: "+ EncodeColor(colorBrightGreen)+C
+ EncodeColor(colorRed)+   "\n                  Lo: "+ EncodeColor(colorWhite)+L

+" \n "

;There are two codes:
This one is really smooth:
And this one is from AB E-mail archive:
This one is really smooth:
// - there was a plot limit call introduced after 5.41.0 beta
// i.e. "•Warning 502: Calling Plot()/PlotOHLC over 500 times is displayed in indicator in runtime to prevent abuse"
// - uses GFX for major calls of plot only if AB version newer than 5.40 - this only delays reaching the plot limit
// http://www.***********.com/amibroker/2961-market-profile-amibroker-new-13.html
Version (5.80);
PS_SOLID=0;
PS_DASH=1;
PS_DOT=2;
PS_DASHDOT=3;
PS_DASHDOTDOT=4;
PS_NULL=5;
PS_INSIDEFRAME=6;
function Lastthursday()
{
Daysinmonth=
IIf(Month()==2, IIf(Year()%4==0 AND Year()%100!=0,29,28),
IIf(Month()==4 OR Month()==6 OR Month()==9 OR Month()==11,30,31));
return IIf(Daysinmonth-Day()<7 AND DayOfWeek()==4,1,
IIf(Daysinmonth-Day()<8 AND DayOfWeek()==3 AND Ref(DayOfWeek(),1)!=4 AND Day()!=Daysinmonth,1,0));
}
procedure GfxPlotLine( ix0, iy0, ix1, iy1, iColor, iWidth, iStyle)
{
GfxSetBkMode(1);
GfxSelectPen( iColor, iWidth, iStyle );
GfxMoveTo( ix0, iy0 );
GfxLineTo( ix1, iy1 );
}
//PlotOHLC( O, H, L, C, "Price", IIf( C > O, colorGreen, colorRed ), styleCandle );
FirstVisibleBar = Status( "FirstVisibleBar" );
Lastvisiblebar = Status( "LastVisibleBar" );
totalVisible = Lastvisiblebar - FirstVisibleBar;
//Den = Param("Density", 1, 0.1, 10, 0.1);
percent = Param( "Value Area", 70, 1, 100, 1 );
Type = ParamList( "Type", "Price Profile|Volume Profile" );
Period = ParamList( "Base", "Hourly|Daily|Weekly|Monthly|Lastthursday|Yearly", 1 );
x_scale = Param( "Horizontal_scale", 1, 0, 10, 0.1 );
EnMP2 = ParamStyle( "Style", styleLine | styleNoLabel, maskAll );
EnIB = ParamToggle( "Show Initial Balance", "No|Yes", 1 );
IBBars = Param( "Initial Balance Bars", 2, 1, 10, 1 );
ViewYvalues = ParamToggle( "Show Yesterdays Values", "No|Yes", 1 );
ViewVlines = ParamToggle( "Show Vertical Base Lines", "No|Yes", 0 );
Viewvalues = ParamToggle( "Show Values", "No|Yes", 0 );
ViewVpoc = ParamToggle( "Show Virgin POC", "No|Yes", 0 );
ViewTPO = ParamToggle( "Show TPO Count", "No|Yes", 1 );
Color_Above_VA = ParamColor( "Color_Above_VA", colorGrey40 );
Color_VA = ParamColor( "Color_VA", colorTeal );
Color_Below_VA = ParamColor( "Color_Below_VA", colorGrey40 );
Color_POC_line = ParamColor( "Color_POC_Line", colorRed );
color_YVAH = ParamColor( "Previous VAH", colorTeal );
color_YVAL = ParamColor( "Previous VAL", colorTeal );
color_YPOC = ParamColor( "Previous POC", colorDarkRed );
IBColor = ParamColor( "IB Color", colorWhite );
IBstyle = ParamStyle( "IB style", styleDashed | styleNoLabel, maskAll );
Color_Virgin_POC = ParamColor( "Virgin Poc Color", colorRed );
Color_Base_Line = ParamColor( "Base Line Color", colorDarkGrey );
switch (Period)
{
case "Yearly":
BarsInDay = BarsSince(Year() != Ref(Year(), -1));
tf = inMonthly;
break;
case "Monthly":
BarsInDay = BarsSince(Month() != Ref(Month(), -1));
tf = inMonthly;
break;
case "Weekly":
BarsInDay = BarsSince(DayOfWeek() < Ref( DayOfWeek(), -1 ));
tf = inWeekly;
break;
case "Hourly":
BarsInDay = BarsSince(Hour() != Ref(Hour(), -1));
tf = inHourly;
break;
case "Daily":
BarsInDay = BarsSince(Day() != Ref(Day(), -1));
tf = inDaily;
break;
}
if(Period=="Lastthursday" )
{
BarsInDay = BarsSince(Lastthursday()==0 AND Ref(Lastthursday(), -1)==1);
bot1=ValueWhen(BarsInDay==0,L);
Bot2 = ValueWhen(Ref(BarsInDay)==1 OR BarIndex()>BarCount-2 ,LLV(L,BarsInDay),0);
bot=Min(bot1,bot2);
top1=ValueWhen(BarsInDay==0,H);
Top2 =ValueWhen(Ref(BarsInDay,1)==1 OR BarIndex()>BarCount-2,HHV(H,BarsInDay),0);
top=Max(top1,top2);
Vol = ValueWhen(Ref(BarsInDay,1)==1 OR BarIndex()>BarCount-2 ,Sum(V,BarsInDay),0);
}
else
{
Bot = TimeFrameGetPrice("L", tf, 0);
Top = TimeFrameGetPrice("H", tf, 0);
Vol = TimeFrameGetPrice("V", tf, 0);
}
CurTop = HHV( H, BarsInDay + 1 );
Curbot = LLV( L, BarsInDay + 1 );
Range = Top - Bot;
coverage = LastValue( Ref( ATR( 10 ), -1 ) );
den = ( coverage / 10 );
//den=1;
multiplier = IIf( round( totalVisible ) / 300 < 1, 1, round( totalVisible ) / 300 );
if ( ViewVlines)
Plot( BarsInDay == 0, "", Color_Base_Line, styleHistogram | styleOwnScale | styleLine | styleNoLabel );
relTodayRange = 0;
x = 0;
basey = 0;
basex = 0;
newday = 0;
total = 0;
shiftup = 0;
shiftdn = 0;
//Line = Null;
Voloumeunit = 0;
GfxSetOverlayMode( 1 );
GfxSetCoordsMode( 1 ); // bar/price mode (instead of pixel)
for ( i = IIf( FirstVisibleBar - 100 > 1, FirstVisibleBar - 100, FirstVisibleBar ); i < Lastvisiblebar AND i < BarCount - 1 ; i++ )
{
if ( BarsInDay == 0 )
{
t = BarsInDay[i-1];
if ( EnIB )
{
IBH = HHV( H, IBBars );
IBL = LLV( L, IBBars );
/*
Line1 = LineArray( basex, IBH[basex+IBBars-1], i, IBH[basex+IBBars-1] );
Plot( Line1, "", IBColor, IBstyle );
Line2 = LineArray( basex, IBL[basex+IBBars-1], i, IBL[basex+IBBars-1] );
Plot( Line2, "", IBcolor, IBstyle );
*/
GfxPlotLine(basex, hY=IBH[basex+IBBars-1], i, hY,
IBColor, 1, PS_SOLID);
GfxPlotLine(basex, hY=IBL[basex+IBBars-1], i, hY,
IBColor, 1, PS_SOLID);
}
//////////////////////////////////
poc = 0;
pocj = 0;
midrange = int( relTodayRange / 2 ) + 1;
for ( j = 1; j <= relTodayRange + 1 ; j++ )
{
if ( poc < x[j] )
{
poc = x[j];
pocj = j;
}
else
if ( poc == x[j] )
{
if ( abs( midrange - j ) < abs( midrange - pocj ) )
{
poc = x[j];
pocj = j;
}
}
}
for ( n = 1; n <= relTodayRange; n++ )
total[n] = x[n] + total[n-1];
Value_area = ( total[relTodayRange] * percent ) / 100;
for ( a = 1; a <= relTodayRange; a++ )
{
if ( pocj - a > 0 AND pocj + a < relTodayRange )
{
if ( poc + total[pocj+a] - total[pocj] + ( total[pocj] - poc ) - total[pocj-( a+1 )] >= Value_area )
{
shiftup = shiftdn = a;
break;
}
}
else
if ( pocj - a < 1 )
{
if ( poc + total[pocj+a] - total[pocj] + ( total[pocj] - poc ) >= Value_area )
{
shiftup = a;
shiftdn = pocj;
break;
}
}
else
if ( pocj + a > relTodayRange )
{
if ( poc + total[relTodayRange] - total[pocj] + ( total[pocj] - poc ) - total[pocj-( a+1 )] >= Value_area )
{
shiftup = floor( relTodayRange ) - pocj;
shiftdn = a + 1;
break;
}
}
}
//Vah = LineArray( baseX, baseY + ( pocj + shiftup ) * den, i, baseY + ( pocj + shiftup ) * den );
//Val = LineArray( baseX, baseY + ( pocj - shiftdn ) * den, i, baseY + ( pocj - shiftdn ) * den );
//pocline = LineArray( basex, basey + pocj * den, basex + poc, basey + pocj * den );
if ( ViewVpoc)
{
Virginpoc = basey + pocj * den;
newi = Null;
for ( j = i; j <= ( BarCount - 1 ) ; j++ )
if ( L[j] < Virginpoc AND H[j] > Virginpoc )
{
newi = j;
break;
}
else
newi = BarCount;
Plot( LineArray( basex, hY=basey + pocj*den, newi, hY), "", Color_Virgin_POC, styleNoRescale );
}
if ( ViewYvalues)
{
//Vahn = LineArray( i, baseY + ( pocj + shiftup ) * den, i + t, baseY + ( pocj + shiftup ) * den );
//pocn = LineArray( i, baseY + ( pocj ) * den, i + t, baseY + ( pocj ) * den );
//Valn = LineArray( i, baseY + ( pocj - shiftdn ) * den, i + t, baseY + ( pocj - shiftdn ) * den );
GfxPlotLine( i, baseY + ( pocj + shiftup ) * den, i + t, baseY + ( pocj + shiftup ) * den,
color_YVAH, 0, PS_DOT);
GfxPlotLine( i, baseY + ( pocj ) * den, i + t, baseY + ( pocj ) * den,
color_YPOC, 0, PS_DOT);
GfxPlotLine(i, baseY + ( pocj - shiftdn ) * den, i + t, baseY + ( pocj - shiftdn ) * den,
color_YVAL, 0, PS_DOT);
//Plot( Vahn, "", color_YVAH, styleDashed | styleNoRescale );
//Plot( Valn, "", color_YVAL, styleDashed | styleNoRescale );
//Plot( pocn, "", color_YPOC, styleDashed | styleNoRescale );
}
if ( ViewTPO )
{
nnn = HHV( H, BarsInDay );
PlotText( "" + ( total[relTodayRange] - total[pocj] ), basex, nnn, colorLightGrey );
PlotText( "" + ( total[pocj-1] ), basex, basey - den, colorLightGrey );
}
if ( Viewvalues)
{
PlotText( "" + ( ( basey + pocj*den ) ), baseX, basey + pocj*den, colorWhite, colorDarkGrey );
PlotText( "" + ( ( baseY + ( pocj + shiftup )*den ) ), baseX, baseY + ( pocj + shiftup )*den, colorWhite, colorDarkGrey );
PlotText( "" + ( ( baseY + ( pocj - shiftdn )*den ) ), baseX, baseY + ( pocj - shiftdn )*den, colorWhite, colorDarkGrey );
}
//-- Plot Market Profile
for ( p = 0; p <= relTodayRange + 1; p = p + multiplier )
{
GfxPlotLine( baseX, hY=baseY + p * Den, baseX + x[p], hY,
IIf( p > ( pocj + shiftup ), Color_Above_VA,
IIf( p <= ( pocj + shiftup ) AND p >= ( pocj - shiftdn ), Color_VA,
Color_Below_VA )), 1, PS_SOLID);
}
//-- Plot PoC
GfxPlotLine( baseX, hY = basey + pocj * den, basex + poc, hY,
Color_POC_Line, 1, PS_SOLID);
///////////////////
basex = 0;
x = 0;
Basex = i;
baseY = Bot;
relTodayRange = Range / Den;
Voloumeunit = Vol / LastValue( BarsInDay );
}
for ( j = 0; j <= relTodayRange ; j++ )
{
if ( L <= Bot + j*Den AND H >= Bot + j*Den )
{
if ( Type == "Price Profile" )
{
x[j] += x_scale;
}
else
if ( Type == "Volume Profile" )
{
x[j] += round( V / Voloumeunit ) + 1;
}
}
}
}
if ( EnIB )
{
IBH = HHV( H, IBBars );
IBL = LLV( L, IBBars );
Line1 = LineArray( basex, IBH[basex+IBBars-1], i, IBH[basex+IBBars-1] );
Plot( Line1, "", IBColor, IBstyle );
Line2 = LineArray( basex, IBL[basex+IBBars-1], i, IBL[basex+IBBars-1] );
Plot( Line2, "", IBColor, IBstyle );
}
//////////////////////////////////
poc = 0;
pocj = 0;
midrange = int( relTodayRange / 2 ) + 1;
for ( j = 1; j <= relTodayRange + 1 ; j++ )
{
if ( poc < x[j] )
{
poc = x[j];
pocj = j;
}
else
if ( poc == x[j] )
{
if ( abs( midrange - j ) < abs( midrange - pocj ) )
{
poc = x[j];
pocj = j;
}
}
}
for ( n = 1; n <= relTodayRange; n++ )
total[n] = x[n] + total[n-1];
Value_area = ( total[relTodayRange] * percent ) / 100;
for ( a = 1; a <= relTodayRange; a++ )
{
if ( pocj - a > 0 AND pocj + a < relTodayRange )
{
if ( poc + total[pocj+a] - total[pocj] + ( total[pocj] - poc ) - total[pocj-( a+1 )] >= Value_area )
{
shiftup = shiftdn = a;
break;
}
}
else
if ( pocj - a < 1 )
{
if ( poc + total[pocj+a] - total[pocj] + ( total[pocj] - poc ) >= Value_area )
{
shiftup = a;
shiftdn = pocj;
break;
}
}
else
if ( pocj + a > relTodayRange )
{
if ( poc + total[relTodayRange] - total[pocj] + ( total[pocj] - poc ) - total[pocj-( a+1 )] >= Value_area )
{
shiftup = floor( relTodayRange ) - pocj;
shiftdn = a + 1;
break;
}
}
}
Vah = LineArray( baseX, baseY + ( pocj + shiftup ) * den, i, baseY + ( pocj + shiftup ) * den );
Val = LineArray( baseX, baseY + ( pocj - shiftdn ) * den, i, baseY + ( pocj - shiftdn ) * den );
pocline = LineArray( basex, basey + pocj * den, basex + poc, basey + pocj * den );
if ( ViewTPO)
{
PlotText( "" + ( total[relTodayRange] - total[pocj] ), basex, top, colorLightGrey );
PlotText( "" + ( total[pocj-1] + x_scale ), basex, basey - den, colorLightGrey );
}
if ( Viewvalues )
{
PlotText( "" + ( ( basey + pocj*den ) ), baseX, basey + pocj*den, colorWhite, colorDarkGrey );
PlotText( "" + ( ( baseY + ( pocj + shiftup )*den ) ), baseX, baseY + ( pocj + shiftup )*den, colorWhite, colorDarkGrey );
PlotText( "" + ( ( baseY + ( pocj - shiftdn )*den ) ), baseX, baseY + ( pocj - shiftdn )*den, colorWhite, colorDarkGrey );
}
for ( p = 0; p <= relTodayRange + 1; p = p + multiplier )
{
GfxPlotLine( baseX, hY=baseY + p * Den,
baseX + x[p], hY,
IIf( p > ( pocj + shiftup ), Color_Above_VA,
IIf( p <= ( pocj + shiftup ) AND p >= ( pocj - shiftdn ), Color_VA, Color_Below_VA )), 1, PS_SOLID);
}
Plot( pocline, "", Color_POC_Line, styleNoRescale | styleNoLabel );
And this one is from AB E-mail archive:
//File: AB - Market Profile - 171
//version 1.71
_N(FileName = "Market Profile 1.71");
_N(VAP_Version = "1.71");
//
//December 17, 2007
//
//
//
//Market Profile based on volume distribution
//Program plots volume at price for various time frames as specified by parameters.
//Program also displays the instantaneous volume and cumulative volume for the chosen time frame at bottom of screen.
//
//
//Known Issues: version 1.71
//Program has been tested with QP data for EOD and eSignal and iqfeed for real time.
//Code works well for EOD data.
//Real time has 2 issues:
// 1. Occasionally display has to be shrunk or expanded to display properly.
// the problem arises from computing the first visible bar and Quick AFL changing the number of bars available
// when time frames are changed or dissplay is shrunk or expanded.
// 2. Real time display is organized in two groups. Display for one full day and display shorter time periods.
// The shorted time periods do not work properly and the opions is inhibited in the parameter settings.
//
//The code is heavy on CPU usage and it is useful to run it once at the end of each bar for real time.
//Compiling code may be useful in speeding up execution.
//
//
//SetBarsRequired(10000,0);
// Functions - Real time data: Compute_RT_Intraday_1, Compute_RT_Daily, Compute_EOD_Weekly,
// Functions - EOD Data: Compute_EOD_Monthly, Compute_EOD_Quarterly
// Functions - FindFirstBar, DataCollect, DataReconstruct, PlotChart, PlotVolumeStats, Plot_POC_UVA_LVA.
// Functions - Verify Volume - Generate error message if volume is not available
// Functions - UpdateDynamicVars - Create names for dynamic variables
// Functions - ComputeDataBlockParms - Compute values for each block. Use start and end markers for blocks
//
//globals. VMP prefix used for all globals so they are unique to this module.
//
// =========================================================================================================
//
// SETUP
// Time marker should be set up at begining of bar
//
// =========================================================================================================
//
///SetBarsRequired(1000,0);
VMP_Control = 0; // Controls whether parameters are local or controlled from calling program
//
VMPperiods = 0; // Number of block of data (weeks, months etc.)
VMPDispPeriod = ""; // Used in title
VMPNumSteps = 150; // Number of price steps for entire range
VMPPeriod_High = 0; // High price for a specific data block (period)
VMPPeriod_Low = 0; // Low price for a specific data block (period)
VMPStartBar = 0; // First bar in a data block
VMPEndBar = 0; // Last bar in a data block
VMPNumdays = 0; // Number of bars in a data block
VMPPrice_Step = 0; // Price increment per volume bucket
VMPMin_Price = 0; // Min Price for visible range - not needed?? also associated code
VMPMax_Price = 0; // Max Price for visible range - not needed??
//
//
VMP_Group_PeakVolume = 0;
VMPDisplay_Block = "";
VMPVol_Error = "";
//
// Create root for dynamic variables
VMP_GroupPeakVol = "";
VMP_BlockStartBar = "";
VMP_Blockvol = "";
VMP_BlockVol1 = "";
VMP_BlockVol2 = "";
VMP_BlockPeakVol = "";
VMP_NumDays = "";
VMP_MinStep = "";
VMP_MaxStep = "";
VMP_BlockHigh = "";
VMP_BlockLow = "";
//Compute Data Interval
//Variables: EOD, Weekly, Monthly, RT, DateStamp, MDYear, TimeStamp
EOD = IIf(Interval() > 80000 AND Interval() < 100000,1,0);
Weekly = IIf(Interval() > 100000 AND Interval() < 1000000,1,0);
Monthly = IIf(Interval() > 2000000,1,0);
RT = IIf(Interval() < 23401,1,0);
//Compute Date
Y1 = Year();
M1 = Month();
D1 = Day();
_N(DateStamp = WriteVal(M1,1.0) + "/" + WriteVal(D1,1.0) + "/" + WriteVal(Y1,1.0));
_N(DateStamp2 = WriteVal(M1,1.0) + "-" + WriteVal(D1,1.0) + "-" + WriteVal(Y1,1.0));
//Compute Time
Hr = Hour();
Mn = Minute();
Sc = Second();
_N(TimeStamp = WriteVal(Hr,1.0) + ":" + WriteIf(Mn<10,"0","") + WriteVal(Mn,1.0)
+ ":" + WriteIf(Sc<10,"0","") + WriteVal(Sc,1.0)
+ WriteIf(Hr<12,"am","pm"));
// ****************************************************************************
if (RT==0)
{
VMP_TimeFrame = Param("1=Q, 2=M, 3=W",2,1,3,1);
}
else
{
VMP_TimeFrame = Param("4=Day, 5=Int",4,4,5,1);
VMP_Mini_Period = Param("Mini Period",60,20,120,10);
}
VMP_Scaling = Param("Scaled=0, Full=1",1,0,1,1);
VMP_Periods = Param("Num Periods",0,0,150,1);
VMP_Vol_Plot = Param("Vol_Plot",1,0,1,1);
Debug_ = Param("Debug",1,0,1,1);
//
VMP_Stat = Status("action");
Debug = Debug_ AND VMP_Stat ==1;
//
//
//Amibroker Status
//Preferences set to mark time at "06:30" and "13:10"
//Time stamp must be for start of bar
VMP_StartTime = 63000;
VMP_EndTime = 131000;
Minutes_perday = 405;
//
bar_Index = BarIndex();
Lastbar_Index = BarCount-1;
LastBar_Number = LastValue(BarIndex());
//
//
//
//
// ============================== Start Functions ================================
//Function Definitions
//
// ======================== Start Function ComputeDataBlockParms ==========================
//
//
function VerifyVolume()
{
// Verify that volume is available
Vol_Test = IIf(LastValue(Sum(Volume,10)),1,0);
return Vol_Test;
}
//
//
function UpdateDynamicVars(m)
{
VMP_GroupPeakVol = "VMP:GroupPeakVol";
VMP_BlockStartBar = "VMP:BlockStartBar_" + NumToStr(m,1.0);
VMP_Blockvol = "VMP:Blockvol_" + NumToStr(m,1.0);
VMP_BlockVol1 = "VMP:BlockVol1_" + NumToStr(m,1.0);
VMP_BlockVol2 = "VMP:BlockVol2_" + NumToStr(m,1.0);
VMP_BlockPeakVol = "VMP:BlockPeakVol_" + NumToStr(m,1.0);
VMP_NumDays = "VMP:NumDays_" + NumToStr(m,1.0);
VMP_MinStep = "VMP:MinStep_" + NumToStr(m,1.0);
VMP_MaxStep = "VMP:MaxStep_" + NumToStr(m,1.0);
VMP_BlockHigh = "VMP:BlockHigh_" + NumToStr(m,1.0);
VMP_BlockLow = "VMP:BlockLow_" + NumToStr(m,1.0);
}
//
//
function ComputeDataBlockParms(j,Time_Block)
{
VMPNumdays = LastValue(ValueWhen(Time_Block==2 OR Time_Block==3,BarsSince(Time_Block==1 OR Time_Block==3),j)) +1;
VMPStartBar = LastValue(ValueWhen(Time_Block==1 OR Time_Block==3,Bar_Index,j));
//
VMPEndBar = VMPStartBar + VMPNumdays-1;
//
VMPPeriod_High = LastValue(Ref(HHV(High,VMPNumdays),-(LastBar_Number - VMPEndBar)));
VMPPeriod_Low = LastValue(Ref(LLV(Low,VMPNumdays),-(LastBar_Number - VMPEndBar)));
//
if (VMPEndBar > LastBar_Number)
_TRACE("VMP171-DBP-0 - End Bar " + VMPEndBar + " Last Bar " + LastBar_Number);
if (Debug==1)
{
_TRACE("VMP171-DBP-1 - j " + j + " StartBar " + VMPStartBar + " Numdays " + VMPNumdays + " EndBar " + VMPEndBar
+ " PHigh " + VMPPeriod_High + " PLow " + VMPPeriod_Low);
}
}
//
//
//
// ============================ end function ComputeDataBlocks =============================
//
//
// ================================= start function FindFirstBar ================================
//
//Compute number of bar on screen
function FindFirstBar(TimeFrame)
{
Max_price_ = Min_price_ = Bars = 0;
BarsperInterval = 0;
//
if (VMP_Stat ==1)
{
//
if (TimeFrame ==5)
{
Bars = LastValue(BarsSince(TimeNum()==VMP_StartTime)) + 1;
}
else
{
FirstBar = LastBar_Number - Status ( "firstvisiblebar") - bar_index[0]; // result is in array index domain (not barindex).
LastBar = LastBar_Number - Status ( "lastvisiblebar") - bar_index[0];
Bars = FirstBar - LastBar;
Bars = LastBar_Number - Status ( "firstvisiblebar") - bar_index[0]; // original
_TRACE("VMP171-FFB - FirstBar " + FirstBar + " LastBar " + LastBar + " Bars " + Bars + " FVBar " + Status ( "firstvisiblebar") + " BarCount " + BarCount);
}
//
// SetBarsRequired(Bars,0);
//
// Compute max number of blocks possible with number of bars available
Max_price_ = LastValue(HHV(High,Bars)); // original
Min_price_ = LastValue(LLV(Low,Bars));
_TRACE("VMP171-FFB-0 - min Price " + Min_price_ + " max price " + Max_price_);
/*
Max_price_ = LastValue(Ref(HHV(High,Bars),-LastBar));
Min_price_ = LastValue(Ref(LLV(Low,Bars),-LastBar));
*/
if (debug)
_TRACE("VMP171-FFB-1 - Bars " + Bars);
}
//
if (VMP_Periods ==0)
{
//if VMP_Periods is set to zero, compute periods dynimically
switch(TimeFrame)
{
case 1: VMP_Periods = int(Bars / 66); break; // Quarter
case 2: VMP_Periods = int(Bars / 21); break; // Month
case 3: VMP_Periods = int(Bars / 5); break; // Week
// Below using ceil() instead in int() allows an extra bar making it possible for 60 and 120 min bars to work properly
case 4: BarsperInterval = ceil(Minutes_perday * 60 / Interval(0));
VMP_Periods = ceil(Bars / BarsperInterval); break; // Day
//case 5: BarsperInterval = int(VMP_Mini_Period * 60 / Interval(0));
// VMP_Periods = int(Bars / BarsperInterval) +0; break; // Intraday
} // end switch
} // end VMP_Periods ==0
/*
else xxxxxxxxxxxxxxxxxxxxxxxxxxxxxxx
{
//Insure that number of periods specified are possible within the available bars. xxxxxxxxxxxxxx
switch(TimeFrame)
{
case 1: VMP_Periods = int(Bars / 66) +0; break; // Quarter
}
}
*/
//
//
//
Price_Range = Max_Price_ - Min_Price_;
//
//These 3 variables are used later on
VMPPrice_Step = Price_Range / VMPNumSteps;
//Offset Max and Min Prices to avoid problems when Max_price = High ...etc
VMPMax_Price = Max_Price_ + (0.01 * Price_Range);
VMPMin_Price = Min_Price_ - (0.01 * Price_Range);
//
if (debug)
{
_TRACE("VMP171-FFB-2 - FindFirst - Bars " + Bars + " Periods " + VMP_Periods + " Min " + Min_Price_ + " Max " + Max_Price_);
_TRACE("VMP171-FFB-3 - PriceRange " + Price_Range + " NumSteps " + VMPNumSteps + " PriceStep " + VMPPrice_Step);
}
return Bars;
} // end function FindFirstBar
//
// =================================== end FindFirstBar ==================================
//
// ======================== Start Function Compute_RT_Intraday_1 ==========================
//
//
function Compute_RT_Intraday()
{
LB = SB = 0;
Bars_perblock = 0;
//Define function parameters
//Compute following variable for future use
//
//Items below are applicable for entire day. Need to be processed only once per day (m==1)
//
VMPDispPeriod = "Intraday";
VMPDisplay_Block = "Time Block " + NumToStr(VMP_Mini_Period,1.0) + " Minutes";
//
//
//Find bars on screen and copmute screen parms
//FirstBar = FindFirstBar(VMP_TimeFrame); // xxxxxxxxxxxxxxxxxxxxxxxxxxxx
//
//Find number of bars since start of day
//Computed for real time
Bars_past = LastValue(BarsSince(TimeNum()==VMP_StartTime)) + 1;
_TRACE("BarsPast - Bars " + Bars_Past);
//SetBarsRequired(Bars_Past + 20,0); // xxxxxxxxxxxxxxxxxxxxxxxxxxxxxxxxxxxxxxxxxxxxx
//Compute number of timeblocks as defined in "minitimes"
timeBlocks_1 = int(LastValue(Bars_past *Interval() / 60 / VMP_Mini_Period)); // completed timeblocks
timeBlocks_2 = LastValue(Bars_past *Interval() / 60 / VMP_Mini_Period); // completed timeblocks + one in progress
//
//Total number of timeblocks
if (TimeBlocks_1 == TimeBlocks_2)
{
//All time blocks are completed (on last bar of block)
TimeBlocks = TimeBlocks_1;
}
else
{
//Time blocks completed plus in progress
TimeBlocks = TimeBlocks_1+1;
}
//
VMPPeriods = Timeblocks;
//
Bars_PerBlock = VMP_Mini_Period * 60 / Interval();
//
//
//Define starting bar for day
Start_bar = LastValue(ValueWhen(TimeNum()==VMP_StartTime,Bar_Index,1));
_TRACE("BarsPast - Start Bar " + Start_Bar + " Last bar " + LastBar_Number);
//
//
//Mark array with 1=Start, 2=end of TimeBlock
if (debug==1)
{
_TRACE("VMP171-RTI-1 - Initial Vars - minitimes " + VMP_Mini_Period + " TimeNum " + TimeNum() + " STime " + VMP_StartTime
+ " Bars Past " + Bars_Past);
_TRACE("VMP171-RTI-2 - BarsPast " + Bars_Past); // // Total bars current day
_TRACE("VMP171-RTI-3 - TB1 " + TimeBlocks_1 + " TB2 " + TimeBlocks_2 + " T Blocks " + TimeBlocks );
}
//
//
//
//Find starting and ending bars for each time block - Loop
x=0;
do
{
if (debug==1)
{
_TRACE("VMP171-RTI-4A - Status " + VMP_Stat /*+ " Trade_Period " + Trade_Period*/ + " x= " + x + " TB " + Timeblocks);
}
//Last time block
TB = TimeBlocks-1;
if (x==TB)
{
//if there is only one timeblock, then block may not be complete. last bar is last bar of data
SB = Start_Bar + (x*(Bars_PerBlock)) - Bar_Index[0];
LB = LastBar_Number - Bar_Index[0];
//
if (debug==1)
{
_TRACE("VMP171-RTI-4B - TB " + TB + " SB " + SB + " LB " + LB);
}
} // end x==TB
else
{
//Data block is complete
SB = Start_Bar + (x*(Bars_PerBlock)) - Bar_Index[0];
LB = Start_Bar + ((x+1)*(Bars_PerBlock)) - 1 - Bar_Index[0];
//
if (debug==1)
{
_TRACE("VMP171-RTI-4C - TB " + TB + " SB " + SB + " LB " + LB);
}
} // end if x==TB
//
//if only one bar exists in a new timeblock (SB==LB), mark it as starting bar.
if (SB==LB)
{
//First bar of time block
Time_Block[SB] = 1;
//
if (debug==1)
{
_TRACE("VMP171-RTI-4D - TB " + TB + " SB " + SB + " LB " + LB + " SB Mark " + Time_Block[SB] + " LB Mark " + Time_Block[LB]);
}
} // end SB==LB
else
{
//Mark starting bar as "1" and ending bar as "2"
Time_Block[SB] = 1;
Time_Block[LB] = 2;
//
//
if (debug==1)
{
_TRACE("VMP171-RTI-4E - TB " + TB + " SB " + SB + " LB " + LB + " SB Mark " + Time_Block[SB] + " LB Mark " + Time_Block[LB]);
}
} // end if (SB==LB)
//
if (debug==1)
{
_TRACE("VMP171-RTI-5A - Status " + VMP_Stat /*+ " Trade_Period " + Trade_Period*/ + " x= " + x + " SB= " + SB + " LB= " + LB
+ " Last Bar# " + LastBar_Number + " #Bars " + Bars_PerBlock);
_TRACE("VMP171-RTI-5B - SB Mark " + Time_Block[SB] + " LB Mark " + Time_Block[LB]);
}
//
x++;
} while (x < TimeBlocks AND x <30);
//
Time_Block[LB] = IIf(Time_Block[LB]==1,3,2); // Modify last bar if ==1
// Entire day has been marked for each intraday segment
//
return Time_Block;
} // end function RT_Intraday
//
//
// =============================== end function RT_Intraday_1 =================================
//
// ============================= start function Compute_RT_Daily ==============================
//
//Time block = 1 full day
function Compute_RT_Daily()
{
//Items below are applicable for entire day. Need to be processed only once per day (m==1)
//Should be placed in static variables
//
//m=0;
TimeBlocks = VMP_Periods;
//
//Daily
VMPDispPeriod = "Day";
VMPPeriods = VMP_Periods;
VMPDisplay_Block = "Time Block 1 Day";
//
// Specify number of minutes based on issue (Futures =400, Stocks=390 and change start stop times)
Bars_PerBlock = (Minutes_perday * 60 / Interval(0)) +1; // for debug only
//
//
//Start_bar = ValueWhen(TimeNum()==VMP_StartTime,Bar_Index,1);
//
//Mark Starting and ending bars of each timeblock.
if (VMPDispPeriod =="DayNight") // Day and Night
{
//Need debug
Time_Block = IIf(TimeNum() >=Start_Time AND Ref(TimeNum(),-1) <Start_Time,1,
IIf(TimeNum() <=End_Time AND Ref(TimeNum(),1) >End_Time,2, // same as TimeNum()==End_Time???
IIf(LastBar_Number==Bar_Index AND TimeNum() < End_Time,2,0)));
}
else // Regular trading hours only
{
Time_Block = IIf(TimeNum() >=VMP_StartTime AND DateNum() > Ref(DateNum(),-1),1,
IIf((TimeNum() <=VMP_EndTime AND DateNum() < Ref(DateNum(),1)) OR TimeNum() == VMP_EndTime,2,
IIf(LastBar_Number==Bar_Index AND TimeNum() < VMP_EndTime,2,0)));
}
Time_Block[Lastbar_Index] = IIf(Time_Block[Lastbar_Index]==1,3,2); // Modify last bar if ==1
//
//
if (Debug ==1)
{
_TRACE("VMP171-RTD-1 - Inital Vars - Trade Period " + Bars_PerBlock + " T Blocks " + TimeBlocks + " B_Block " + Bars_PerBlock);
}
return Time_Block;
} // end function RT_Daily
//
//
// ============================= end function Compute_RT_Daily ==============================
//
// ============================= start function Compute_EOD_Weekly ==============================
Time_Block = 0;
function Compute_EOD_Weekly() //Weekly
{
//
//
//Weekly
VMPDisplay_Block = "Time Block 1 Week";
VMPDispPeriod = "Week";
VMPPeriods = VMP_Periods;
//
/*
for (i=BarCount-10; i<BarCount; i++)
{
//
if (debug)
{
_TRACE("VMP171-TB-Week - Index " + BarCount);
}
//
*/
Time_Block = IIf(DayOfWeek() < Ref(DayOfWeek(),-1),1, // first day of week
IIf(DayOfWeek() > Ref(DayOfWeek(),1),2,0)); // last day of week
Time_Block[Lastbar_Index] = IIf(Time_Block[Lastbar_Index]==1,3,2); // Modify last bar if ==1
//
//
LBI = BarCount-1;
//
/*
for (i=BarCount-10; i<BarCount; i++)
{
_TRACE("VMP171-TB-Week - Periods " + VMPPeriods + " Bar_Index " + i + " Time_Block " + Time_Block + " LBI " + BarCount);
}
//
} // end Barcount loop
*/
return Time_Block;
} // end function EOD_Weekly
//
//
// ============================= end function Compute_EOD_Weekly ==============================
//
// ============================= start function Compute_EOD_Monthly ==============================
//
function Compute_EOD_Monthly()
{
//Export variables: Numdays, Period_High, Period_Low
//
if (Debug ==1)
{
_TRACE("VAP53-EOD-M1 - Enter Monthly function");
}
//
VMPDisplay_Block = "Time Block 1 Month";
VMPPeriods = VMP_Periods;
VMPDispPeriod = "Month";
//
//Problem area with last bar being 1st bar of timeblock
Time_Block = IIf(Day() < Ref(Day(),-1),1, // first day of month
IIf(Day() > Ref(Day(),1)
OR (Day() > Ref(Day(),-1) AND Bar_Index==LastBar_Number),2,0)); // last day of month
Time_Block[LastBar_Index] = IIf(Time_Block[LastBar_Index]==1,3,2); // Modify last bar if ==1
//
if (Debug ==1)
{
for (i=LastBar_Number-Bar_Index[0]-10; i<=LastBar_Number-Bar_Index[0]; i++)
{
//_TRACE("VMP171-TB-Month - Last Number " + LastBar_Number + " Last Index " + LastBar_Index + " B0 " + Bar_Index[0] + " BarCount " + BarCount);
//_TRACE("VMP171-TB-Month - Periods " + VMPPeriods + " Bar_Index " + i + " Time_Block " + Time_Block + " LBI " + LastBar_Number);
}
}
return Time_Block;
} // end function EOD_Monthly
//
//
// ============================= end function Compute_EOD_Monthly ==============================
//
function Compute_EOD_Quarterly()
{
//Export variables: Numdays, Period_High, Period_Low
//
if (Debug ==1)
{
_TRACE("VAP170-EOD-Q1 - Enter Quarterly function");
}
//
VMPDisplay_Block = "Time Block 1 Quarter";
VMPPeriods = VMP_Periods;
VMPDispPeriod = "Quarter";
//
//Problem area with last bar being 1st bar of timeblock
Time_Block = IIf((Day() < Ref(Day(),-1) AND Month()==1) OR (Day() < Ref(Day(),-1) AND Month()==4)
OR (Day() < Ref(Day(),-1) AND Month()==7) OR (Day() < Ref(Day(),-1) AND Month()==10),1, // first day of quarter
IIf((Day() > Ref(Day(),1) AND Month()==3) OR (Day() > Ref(Day(),1) AND Month()==6)
OR (Day() > Ref(Day(),1) AND Month()==9) OR (Day() > Ref(Day(),1) AND Month()==12)
OR (Day() > Ref(Day(),-1) AND Bar_Index==LastBar_Number),2,0)); // last day of quarter
Time_Block[LastBar_Index] = IIf(Time_Block[LastBar_Index]==1,3,2); // Modify last bar if ==1
//
if (Debug ==1)
{
for (i=LastBar_Number-Bar_Index[0]-10; i<=LastBar_Number-Bar_Index[0]; i++)
{
//_TRACE("VMP171-TB-Month - Last Number " + LastBar_Number + " Last Index " + LastBar_Index + " B0 " + Bar_Index[0] + " BarCount " + BarCount);
//_TRACE("VMP171-TB-Month - Periods " + VMPPeriods + " Bar_Index " + i + " Time_Block " + Time_Block + " LBI " + LastBar_Number);
}
}
return Time_Block;
} // end function EOD_Quarterly
//
//
// ===================================== end function Quarterly ===================================
//
//
//
//
// ================================= end function FindFirstBar ================================
//
// ================================= start function Data Collect ================================
//
function DataCollect(TimeFrame)
{
//
//
FirstBar = FindFirstBar(TimeFrame);
//Vars defined: VMP_Periods, Price_Range, VMPPrice_Step, VMPMax_Price, VMPMin_Price.
//
if (Debug==1)
{
_TRACE("VMP171-DC-01 - Status " + VMP_Stat + " Interval " + Interval() / 60 + "min" + " T Period #" + TimeFrame);
_TRACE("VMP171-DC-02 - Visible High / Low - Max_Price " + WriteVal(VMPMax_Price,1.2) + " Min_Price " + WriteVal(VMPMin_Price,1.2)
+ " F Bar " + Firstbar + " LastBar " + LastBar_Number);
}
GetPerformanceCounter( bReset = True );
//
//Variables
//
//Compute Time_Block array - Mark start and end date bars
//Includes all time blocks
//Vars defined: VMPPeriods, Time_Block. - VMP_Periods dynamically defined above is assigned to VMPPeriods
switch(TimeFrame)
{
case 1: Time_Block = Compute_EOD_Quarterly(); break;
case 2: Time_Block = Compute_EOD_Monthly(); break;
case 3: Time_Block = Compute_EOD_Weekly(); break;
case 4: Time_Block = Compute_RT_Daily(); break;
case 5: Time_Block = Compute_RT_Intraday(); break;
}
//
//create data sets (set is a month, week, day etc)
//m represents the period number
m=0;
//
do
{
//loop on period - month / week
m++;
//Define time frame period
//Get StartBar, EndBar and Numdays
//Process Block Parms
j = VMPPeriods - m + 1;
//Variables Returned below as Globals
//VMPNumdays, VMPStartBar, VMPEndBar, VMPPeriod_High, VMPPeriod_Low
ComputeDataBlockParms(j,Time_Block);
//
//
Block_MaxStep = VMPNumSteps - int((VMPMax_Price - VMPPeriod_High) / VMPPrice_Step);
Block_MinStep = int((VMPPeriod_Low - VMPMin_Price) / VMPPrice_Step);
//
if (Debug==1)
{
_TRACE("VMP171-DC-031 - j " + j + " Status " + VMP_Stat + " m " + m + " Numdays " + VMPNumdays + " Start Bar " + VMPStartBar + " End Bar " + VMPEndBar);
_TRACE("VMP171-DC-032 - j " + j + " Block MinStep " + Block_MinStep + " Block MaxStep " + Block_MaxStep);
_TRACE("VMP171-DC-033 - MaxPrice " + VMPMax_Price + " PeriodHigh " + VMPPeriod_High + " Priceperstep " + VMPPrice_Step);
}
//
//
//LOOP THRU DAILY DATA
//Loop through each day of period
//need to estalish max vol for each segment, then scale appropriately for charting.
//Total Volume for period
//
//Variables for entire data block
Sum_Volume_d1 = LastValue(Ref(Sum(Volume,VMPNumdays),-((LastBar_Number - VMPEndBar)))); // Sum of daily volume for data block
Sum_Volume_d2 = 0; // alternate to above
Block_MaxVol = 0; // max volume step for data block
//
//Variables for single bar only
Bar_Steps = 0; // Number of price steps
Bar_MaxStep = 0; // Highest number step
Bar_MinStep = 0; // Lowest number step
DayVolume = 0; // Total volume for bar
Bar_Volume = 0; // Total volume for bar - (alternate for above)
//
if (debug)
{
_TRACE("VMP171-DC-03A - VMPstartbar " + VMPstartbar + " VMPEndBar " +VMPEndBar);
}
//
//initialize dynamic variables to zero in order to keep correct values
//These variables will keep data for entire block. One variable for each step of each block
//Variables are the equivalent of an array in the form of Var[m,i]
//
mm = NumToStr(m,1.0);
for (i=1; i<=VMPNumSteps; i++)
{
VMP_Vol = "VMP_Vol_" + mm + "_" + NumToStr(i,1.0);
VarSet(VMP_Vol,0);
}
//
//
//
Block_Volume = 0;
Peak_BlockVol = 0;
for (dd=VMPstartbar; dd<=VMPEndBar; dd++)
{
if (debug)
_TRACE("VMP171-DC-04-0 - dd " + dd + " BI0 " + Bar_Index[0] + " VMP_Start bar " + VMPstartbar);
//Calculate volume attributable to each step with price bar
Bar_Volume = Volume[dd-Bar_Index[0]]; // Volume for the day
Bar_High = High[dd-Bar_Index[0]];
Bar_Low = Low[dd-Bar_Index[0]];
//
Bar_MaxStep = VMPNumSteps - int((VMPMax_Price - Bar_High) / VMPPrice_Step); // Highest step number (fisrt step with no volume above bar)
Bar_MinStep = int((Bar_Low - VMPMin_Price) / VMPPrice_Step); // Lowest step number (fisrt step with no volume below bar)
Bar_Steps = Bar_MaxStep - Bar_MinStep +1;
Vol_perstep = Bar_Volume / Bar_Steps;
//
Sum_Volume_d2 = IIf(1,Sum_Volume_d2 + Volume[dd-Bar_Index[0]],0); // Sum of daily volume for timeblock - compare value with d1
//
//
if (Debug==1)
{
_TRACE("VMP171-DC-04 - daily loop2 - Status " + VMP_Stat + " Start Bar " + VMPStartBar + " dd= " + dd + " EndBar " + VMPEndBar + " BarCount " + LastBar_Number);
_TRACE("VMP171-DC-05 - daily loop2 - Status " + VMP_Stat + " Bar High " + WriteVal(Bar_High,1.2) + " Bar Low "
+ WriteVal(Bar_Low,1.2) + " Bar Volume " + WriteVal(Bar_Volume/1000,1.0) + "K");
_TRACE("VMP171-DC-06 - daily loop2 - Status " + VMP_Stat + " Min Step " + Bar_MinStep + " max Step " + Bar_MaxStep + " Vol PerStep " + WriteVal(Vol_perstep,1.0) + " Steps " + Bar_Steps);
}
//
//
//Distribute daily volume equally to all applicable price steps
Bar_Volume2 = 0;
Max_Volume = 0;
for (Step=Bar_MinStep; Step<=Bar_MaxStep; Step++)
{
//Max_Group_Volume stores value of largest volume at price for ALL periods.
//Used to scale VMP relative to largest volume.
VMP_Vol = "VMP_Vol_" + mm + "_" + NumToStr(Step,1.0);
VarSet(VMP_Vol,VarGet(VMP_Vol) + (Vol_perStep)); // Volume per price step
//
Bar_Volume2 = IIf(1,Bar_Volume2+Vol_perStep,0); // Alternate to Volume[dd] *
Block_Volume = IIf(1,Block_Volume+Vol_perStep,0); // Volume for entire block
//
if (Debug==1)
{
_TRACE("VMP171-DC-08 - Max Vol_d Summary - m " + m + " dd " + dd + " Step " + Step + " Volume " + WriteVal(VarGet(VMP_Vol)/1000,1.0) + "K"
+ " Bar Vol-2 " + Bar_Volume2/1000 + "K");
}
} // end Step for loop
//
Peak_BlockVol = IIf(Peak_BlockVol < VarGet(VMP_Vol),VarGet(VMP_Vol),Peak_BlockVol); // Peak volume for block
VMP_Group_PeakVolume = IIf(VarGet(VMP_Vol) >VMP_Group_PeakVolume, VarGet(VMP_Vol),VMP_Group_PeakVolume); // Peak volume for all groups
//
if (Debug==1)
{
_TRACE("VMP171-DC-09 - Day Volume_d Summary - m " + m + " Bar Volume " + Bar_Volume/1000 + "K Bar Vol-2 " + Bar_Volume2/1000 + "K");
}
//
} // end dd for loop
//
// Create Dynamic Variables for all parameters
//
UpdateDynamicVars(m); // Set proper subscripts
//
VarSet(VMP_GroupPeakVol,VMP_Group_PeakVolume); // Peak volume step for all groups - used for scaling chart
VarSet(VMP_BlockStartBar,VMPStartBar); // Block Start Bar
VarSet(VMP_BlockVol,Block_Volume); // Total Volume for data block - used for diagnostic
VarSet(VMP_BlockVol1,Sum_Volume_d1); // Total Volume for data block - used for diagnostic - alternate
VarSet(VMP_BlockVol2,Sum_Volume_d2); // Total Volume for data block - used for diagnostic - alternate#2
VarSet(VMP_BlockPeakVol,Peak_BlockVol); // Peak volume for data block - used for scaling chart
VarSet(VMP_NumDays,VMPNumDays); // number of bars in data block
VarSet(VMP_MinStep,Block_MinStep+1); // Smallest price Block step number
VarSet(VMP_MaxStep,Block_MaxStep); // Largest price Block step number
VarSet(VMP_BlockHigh,VMPPeriod_High); // Highest price in block
VarSet(VMP_BlockLow,VMPPeriod_Low); // Lowest price in block - Compute UVA, LVA, POC
//
if (Debug==1)
{
_TRACE("VMP171-DC-10 - Block1 - m " + m + " Block Volume_d Summary - m " + " Numdays " + VMPNumdays + " Sumvol_d 1:2 " + Sum_Volume_d1/1000 + "K / " + Sum_Volume_d2/1000 + "K");
_TRACE("VMP171-DC-11 - Block2 - m " + m + " Dyn Vars: - Start Bar " + VarGet(VMP_BlockStartBar) + " Block Vol-1 " + VarGet(VMP_Blockvol)/1000
+ "K Block Vol-2 " + VarGet(VMP_BlockVol1)/1000 + "K Block Vol-3 " + VarGet(VMP_BlockVol2)/1000 + "K");
_TRACE("VMP171-DC-12 - Block3 - m " + m + " Block Vol " + Block_Volume/1000 +"K Block MaxPeakVol " + VarGet(VMP_BlockPeakVol)/1000 + "K" + " Group Peak Vol " + VarGet(VMP_GroupPeakVol)/1000 + "K");
_TRACE("VMP171-DC-13 - Block4 - m " + m + " NumDays " + VarGet(VMP_NumDays) + " Min Step " + VarGet(VMP_MinStep) + " Max Step " + VarGet(VMP_MaxStep));
}
} while (m<VMPPeriods);
//
} // end function DataCollect
// ======================================== end of data collection =====================================
//
// ======================================= start of data reconstruction ================================
//
//Process Data reconstruction for Value area and POC values
function DataReconstruct()
{
//Analyze saved data for display.
//
FirstBar = FindFirstBar(VMP_TimeFrame);
//Read data from prior section and reconstruct to show volume per price
//Process one data block per pass (n)
n = 0;
do
{
n++;
nn = NumToStr(n,1.0);
//
UpdateDynamicVars(n);
//
/*
//These are redundant vars for diagnostics
VarGet(VMP_BlockVol1); // Total Volume for data block
VarGet(VMP_BlockVol2); // Total Volume for data block
*/
//
//
//Assign value to local variables to speed execution
//Scale variables for plotting
//
if (VMP_scaling ==0)
{
//Scaled as a group
SelVolume = VarGet(VMP_GroupPeakVol)*1.4;
}
else
{
//scale each period as 100%
SelVolume = VarGet(VMP_BlockPeakVol) *1.4;
}
//
Scale_Factor = VarGet(VMP_NumDays);
//
Group_PeakValue = VarGet(VMP_GroupPeakVol); // Peak volume step for all groups - used for scaling chart
Block_Numdays = VarGet(VMP_NumDays); // number of bars in data block
Block_PeakValue = VarGet(VMP_BlockPeakVol); // Peak volume for data block
Block_Volume = VarGet(VMP_BlockVol); // Total Volume for data block
Block_MinStep = VarGet(VMP_MinStep); // Smallest price Block step number
Block_MaxStep = VarGet(VMP_MaxStep); // Largest price Block step number
Block_StartBar = VarGet(VMP_BlockStartBar); // Block Start Bar
Block_MaxValue = VarGet(VMP_BlockHigh); // Largest price Block Value - Diagnostics only
Block_MinValue = VarGet(VMP_BlockLow); // Snallest price Block Value - Diagnostics only
//
UVA_Var = "UVA_" + nn;
LVA_Var = "LVA_" + nn;
//
//Compute UVA, LVA levels
//Compute Value Area upper limit
//
//
if (Debug==1)
{
_TRACE("VMP171-DR-01 Days - n= " + n + " Numdays " + VMPNumdays);
_TRACE("VMP171-DR-02 - Reconstruct - Status " + VMP_Stat + " n " + n + " PLow " + Block_MinValue + " PHigh " + Block_MaxValue
+ " PMax " + VMPMax_Price + " PMin " + VMPMin_Price);
_TRACE("VMP171-DR-03 - Reconstruct - Status " + VMP_Stat + " MinStep " + Block_MinStep + " MaxStep " + Block_MaxStep);
}
//
if (debug)
{
_TRACE("VMP171-DR-06 - Value Area - Max Step " + Block_MaxStep + " Min Step " + Block_MinStep
+ " Block Vol " + Block_Volume/1000 + "K BPeak Value " + Block_PeakValue/1000 +"K Group PeakVol " + Group_PeakValue/1000 + "K");
}
//
//Compute step number for POC - (Max Block Volume)
POC_Volume = 0;
POC_StepNum = 0;
for (i=Block_MinStep-1; i<Block_MaxStep+1; i++)
{
Vol_i = "VMP_Vol_" + nn + "_" + NumToStr(i,1.0);
VMP_Vol = VarGet(Vol_i );
POC_StepNum = IIf(VMP_Vol >POC_Volume,i,POC_StepNum);
POC_Volume = IIf(VMP_Vol >POC_Volume,VMP_Vol,POC_Volume);
//_TRACE("VMP171-DR-07*** - i " + i +" Voli " + Vol_i + " VMP_Vol " + VMP_Vol + " POC Vol " + POC_Volume + " POC SNum " + POC_StepNum);
}
//
//Compute UVA/LVA. Value area volume should be 70% of toal Block Volume
//_TRACE("VMP171-DR-07** - POC Step " + POC_StepNum + " Min Step " + Block_MinStep + " Max Step " + Block_MaxStep);
Stepvalue = POC_StepNum;
VA_Volume = POC_Volume;
kk = Stepvalue +1;
jj = Stepvalue -1;
Loopcount = 0;
do
{
Loopcount++;
Volk = "VMP_Vol_" + nn + "_" + NumToStr(kk,1.0);
Volj = "VMP_Vol_" + nn + "_" + NumToStr(jj,1.0);
VMP_Volk = VarGet(Volk);
VMP_Volj = VarGet(Volj);
//
VA_Volume = IIf(VMP_Volk >=VMP_Volj,VA_Volume +VMP_Volk,VA_Volume);
VA_Volume = IIf(VMP_Volk <= VMP_Volj,VA_Volume +VMP_Volj,VA_Volume);
//
//
//_TRACE("VMP171-DR-07* - lcnt " + loopcount + " kk " + kk + " Max Step " + Block_MaxStep + " Min Step " + Block_MinStep + " jj " + jj + " VAvol " + VA_Volume
// + " kvol " + VMP_Volk + " jvol " + VMP_Volj + " BLvol " + Block_Volume);
if (VMP_Volk >=VMP_Volj AND kk <=Block_MaxStep) kk++;
if (VMP_Volk <= VMP_Volj AND jj >=Block_MinStep) jj--;
} while (VA_Volume < 0.7 * Block_Volume AND Loopcount <VMPNumSteps);
//
upvalstep = kk;
dnvalstep = jj;
//
//
UVA_Value = VMPMin_Price +(upvalstep*VMPPrice_Step); // should be block min price + ...
//UVA_Value = Block_MinValue +(upvalstep*VMPPrice_Step); // should be block min price + ...
VarSet(UVA_Var,UVA_Value);
//
LVA_Value = VMPMin_Price +(dnvalstep*VMPPrice_Step);
//LVA_Value = Block_MinValue +(dnvalstep*VMPPrice_Step);
VarSet(LVA_Var,LVA_Value);
//
//
//Find POC step number
Max_Volume = i_CPOC = i_PPOC = 0;
for (i=Block_MinStep; i<=Block_MaxStep+1; i++)
{
VMP_Vol = "VMP_Vol_" + nn + "_" + NumToStr(i,1.0);
if (VarGet(VMP_Vol) > Max_Volume)
{
Max_Volume = VarGet(VMP_Vol);
//
if (n==VMPPeriods-1) i_PPOC = i;
if (n==VMPPeriods) i_CPOC = i;
//
if (debug ==1)
{
_TRACE("VMP171-DR-09 - n " + n + " Min " + Block_MinStep + " Max " + Block_MaxStep
+ " Block_PeakValuePval " + Block_PeakValue/1000 + "K Max Val " + Max_Volume/1000 + "K i_PPOC " + i_PPOC + " i_CPOC " + i_CPOC);
}
} // end VarGet()
}
//
//
if (n==VMPPeriods-1)
{
StaticVarSet("VMP171_RT_P_UVA",VarGet(UVA_Var));
//
StaticVarSet("VMP171_RT_P_LVA",VarGet(LVA_Var));
}
//
if (n==VMPPeriods)
{
StaticVarSet("VMP171_RT_C_UVA",VarGet(UVA_Var));
//
StaticVarSet("VMP171_RT_C_LVA",VarGet(LVA_Var));
}
//
P_POC_Value = C_POC_Value =0; //initialize
if (n==VMPPeriods-1)
{
P_POC_Value = VMPMin_Price+(i_PPOC*VMPPrice_Step);
//P_POC_Value = Block_MinValue+(i_PPOC*VMPPrice_Step);
StaticVarSet("VMP171_RT_P_POC",P_POC_Value);
}
if (n==VMPPeriods)
{
C_POC_Value = VMPMin_Price+(i_CPOC*VMPPrice_Step);
//C_POC_Value = Block_MinValue+(i_CPOC*VMPPrice_Step);
StaticVarSet("VMP171_RT_C_POC",C_POC_Value);
}
//
//
if (debug)
{
_TRACE("VMP171 - SVars-1 - n " + n + " UVA " + VarGet(UVA_Var) + " LVA " + VarGet(LVA_Var));
_TRACE("VMP171 - SVars-2 - n " + n + " UVA " + StaticVarGet("VMP171_RT_P_UVA") + " LVA " + StaticVarGet("VMP171_RT_P_LVA"));
//
_TRACE("VMP171 - SVars-3 - n " + n + " UVA " + VarGet(UVA_Var) + " LVA " + VarGet(LVA_Var));
_TRACE("VMP171 - SVars-4 - n " + n + " UVA " + StaticVarGet("VMP171_RT_C_UVA") + " LVA " + StaticVarGet("VMP171_RT_C_LVA"));
//
_TRACE("VMP171 - SVars-5 - n " + n + " P_POC " + P_POC_Value + " C_POC " + C_POC_Value);
_TRACE("VMP171 - SVars-6 - n " + n + " P_POC " + StaticVarGet("VMP171_RT_P_POC") + " C_POC " + StaticVarGet("VMP171_RT_C_POC"));
}
if (VMP_Stat==1)
{
//Compute lines to plot - UVA, LVA
for (i=Block_MinStep; i<=Block_MaxStep; i++)
{
//
//Compute Volume Lines
VMP_Vol = "VMP_Vol_" + NumToStr(n,1.0) + "_" + NumToStr(i,1.0);
x0 = Block_StartBar;
x1_ = Nz((VarGet(VMP_Vol) / LastValue(SelVolume) * (Scale_Factor)));
xx1_ = IIf(x1_<1,0,x1_);
x1 = x0 + xx1_;
y0 = y1 = VMPMin_Price + (i*VMPPrice_Step);
//
if (Debug ==1)
{
_TRACE("VMP171-PL-01 - n " + n + " i " + i + " x0 " + x0 + " x1 " + x1 + " y0 " + y0 + " x1_ " + x1_);
_TRACE("VMP171-PL-02 - n " + n + " Vol " + VarGet(VMP_Vol) + " Numdays " + VMPNumdays + " SelVol " + SelVolume);
_TRACE("VMP171-PL-02 - n " + n + " Block Min Step " + Block_MinStep + " Block_MaxStep " + Block_MaxStep);
}
//
Line_Vol = LineArray(x0,y0,x1,y1,0,1);
//
//
if (x0 > LastBar_Number - FirstBar) // Needed to truncate plotting outside of chart
{
Plot(Line_Vol,"",ParamColor("Profile Color",colorWhite),ParamStyle("Profile Style", styleline));
}
//
} // end for Block_MinStep
//
//Compute and plot UVA, LVA lines
x0 = Block_startBar;
x1_UpVal = x1_DnVal = x0 + Block_Numdays-1;
//
y0_UpVal = y1_UpVal = UVA_Value;
y0_DnVal = y1_DnVal = LVA_Value;
Line_UVA = LineArray(x0,y0_UpVal,x1_UpVal,y1_UpVal,0,1);
Line_DVA = LineArray(x0,y0_DnVal,x1_DnVal,y1_DnVal,0,1);
//
//Plot Start and end points
PlotShapes(IIf((Time_Block==1 OR Time_Block==3) AND Bar_Index>=Block_StartBar,shapeCircle,shapeNone),colorYellow,0,Open,0);
PlotShapes(IIf((Time_Block==2 OR Time_Block==3) AND Bar_Index>=Block_StartBar,shapeCircle,shapeNone),colorBlue,0,Close,0);
//Plot - UVA, LVA
Plot(Line_UVA,"",colorWhite,styleDots|styleThick|styleNoLabel);
Plot(Line_DVA,"",colorWhite,styleDots|styleThick|styleNoLabel);
//
//
//
}
//
} while (n < VMPPeriods);
//
//
//Plot prices
//PlotOHLC(O,H,L,C,"",colorBlack,styleCandle);
//
if (Debug ==1)
{
_TRACE("VMP171 - ============================= end of data reconstruct ================================");
}
} // end function Data Reconstruct
//
//
function Plot_POC_UVA_LVA()
{
if (debug)
_TRACE("VMP171-UVA-LVA-01 - BarCount " + BarCount + " POC " + StaticVarGet("VMP171_RT_P_POC") + " UVA " + StaticVarGet("VMP171_RT_P_UVA") + " LVA " + StaticVarGet("VMP171_RT_P_LVA"));
//
//Plot current day Value lines and POCs
POC_Value = StaticVarGet("VMP171_RT_C_POC");
POC_Line = LineArray(BarCount-5,POC_Value,BarCount-1,POC_Value,0,0);
Plot(POC_Line,"",colorRed,styleThick|styleDots|styleNoRescale,0,0,5);
UVA_Value = StaticVarGet("VMP171_RT_C_UVA");
UVA_Line = LineArray(BarCount-5,UVA_Value,BarCount-1,UVA_Value,0,0);
Plot(UVA_Line,"",colorYellow,styleThick|styleDots|styleNoRescale,0,0,5);
LVA_Value = StaticVarGet("VMP171_RT_C_LVA");
LVA_Line = LineArray(BarCount-5,LVA_Value,BarCount-1,LVA_Value,0,0);
Plot(LVA_Line,"",colorYellow,styleThick|styleDots|styleNoRescale,0,0,5);
//
if (debug)
_TRACE("VMP171 - UVA / LVA - Enter Section");
//Plot prior day Value lines and POCs
POC_Value = StaticVarGet("VMP171_RT_P_POC");
POC_Line = LineArray(BarCount-7,POC_Value,BarCount-1,POC_Value,0,0);
Plot(POC_Line,"",colorBlue,styleThick|styleNoRescale,0,0,5);
UVA_Value = StaticVarGet("VMP171_RT_P_UVA");
UVA_Line = LineArray(BarCount-7,UVA_Value,BarCount-1,UVA_Value,0,0);
Plot(UVA_Line,"",colorWhite,styleThick|styleNoRescale,0,0,5);
LVA_Value = StaticVarGet("VMP171_RT_P_LVA");
LVA_Line = LineArray(BarCount-7,LVA_Value,BarCount-1,LVA_Value,0,0);
Plot(LVA_Line,"",colorWhite,styleThick|styleNoRescale,0,0,5);
//
//
}
//
// ================================== end Plot_POC_UVA_LVA() =====================================
//
function PlotVolumeStats()
{
//
global PercVolume;
//Find number of bars since beginning of time block
Bars_inPeriod = BarsSince(Time_Block==1) +1;
//
if (VMP_Vol_Plot==1)
{
Vol_Accumulate = Sum(Volume,Bars_InPeriod);
Time_Num = TimeNum();
PriorVolume = ValueWhen(TimeNum() ==Time_Num,Vol_Accumulate,2); // xxxxxxxxxxx does not work accurately
PercVolume = LastValue(Vol_Accumulate / PriorVolume) * 100;
//Plot Accumulated volume scale
FirstBar = FindFirstBar(VMP_TimeFrame);
VolAcc_High = 5*LastValue(HHV(Vol_Accumulate,FirstBar));
Volume_High = 5*LastValue(HHV(Volume,FirstBar));
//
//Mark time for prior period where volume equals current volume
Time_Num = LastValue(TimeNum());
BarNum = ValueWhen(Time_Num ==TimeNum(),BarIndex(),2);
//Plot(IIf(BarNum==BarIndex(),1,0),"",colorYellow,styleArea|styleOwnScale,0,10);
//
if (RT AND Now(4) > LastValue(TimeNum()))
{
Plottime = 1;
//Plot(Plottime,"",colorPaleGreen,styleArea|styleOwnScale|styleNoLabel,0,20);
}
Plot(Volume,"",ParamColor("Volume Color",colorWhite),ParamStyle("Volume Style", styleLine|styleOwnScale),0,Volume_High);
Plot(Vol_Accumulate,"",ParamColor("Cumulative Volume Color",colorWhite),ParamStyle("Cumulative Volume Style", styleHistogram|styleOwnScale),0,VolAcc_High);
}
} // end Plot Volume Stats
//
// ================================== end Volume Stats =====================================
// ================================== PROGRAM START =====================================
if (Debug==1)
{
_TRACE("VMP171-0 ============================= PROGRAM START =====================================");
_TRACE("VMP171-00 === ====");
}
//
//
VMPVol_Error = "";
Vol_Test = VerifyVolume();
//
// Add VMP_Control parameter for calls from other programs
//
//
//
if (Vol_Test ==1 AND VMP_Stat ==1)
{
//Proceed with program
//GetPerformanceCounter(True);
DataCollect(VMP_TimeFrame);
//GetPerformanceCounter( bReset = True );
//
//Time1 = GetPerformanceCounter(True);
DataReconstruct();
//
//
//Plot_Chart = GetPerformanceCounter( bReset = False );
//
//Time2 = GetPerformanceCounter(True);
if (VMP_Stat ==1)
{
Plot_POC_UVA_LVA();
//ComputeSRLevels(New_Symbol,RT,1);
//
//Time3 = GetPerformanceCounter(True);
/*
if (debug)
{
_TRACE("VMP171-Time - DC-Time1 " + Time1 + " DR-Time2 " + Time2 + " POC-Time3 " + Time3);
_TRACE("VMP171-EOD-0");
}
*/
//
}
}
if (VMP_Vol_Plot==1)
{
PlotVolumeStats();
//
}
else
{
//There is no volume
VolumeTest = VerifyVolume();
if (VolumeTest ==0)
VMPVol_Error = "ERROR - No Volume";
}
//
GraphXSpace = 10;
GraphZOrder=1;
//
_N(Time_Interval = Interval(2));
//
_N(Title = Name() + " " + FileName + " " + Time_Interval + " " + " Period " + VMPDispPeriod + " " + DateStamp + " " + TimeStamp
+ " High " + High + " Low " + Low + " Close " + Close + " Vol " + Volume + " bar# " + Bar_Index
+ "\nVersion: " + VAP_Version + "\n\nPrior Volume " + PercVolume
+ "\n\n" + EncodeColor(colorRed) + VMPVol_Error
+ "\n" + VMPDisplay_Block);
Posting 2 codes. Check if any of them helps.
Note: One of the codes might have compatibility issues which i have no resolution for. I am not the author.
1st Lite Code:
2nd Bigger Heavy Code -- might have compatibility issues
Note: One of the codes might have compatibility issues which i have no resolution for. I am not the author.
1st Lite Code:
PHP:
// Market Profile AFL V2.0
// Last updated by Vimal([email protected]) on 31/12/2014
// Visual experience optimized for black background. It can also be customized for other backgrounds.
//_SECTION_BEGIN("Price");
//SetChartOptions(0,chartShowArrows|chartShowDates);
//volDiff = ROC( V, 1 );
//_N(titleSpecial = " Vol " + WriteVal( V, 1.0 ) +  WriteIf( volDiff < 0,  EncodeColor( colorRed ), EncodeColor( colorGreen ) ) + " (" + WriteVal( volDiff , 1.1 ) + "%%)" +
//						EncodeColor( colorDefault ) + " \nLot Size = " + EncodeColor( colorYellow ) + WriteVal( RoundLotSize, 1.0 ) );
//_N(Title = StrFormat("{{NAME}} - {{INTERVAL}} {{DATE}} Open %g, Hi %g, Lo %g, Close %g (%.1f%%)" + titleSpecial, O, H, L, C, SelectedValue( ROC( C, 1 ) ) ) );
//Plot( C, "Close", ParamColor("Price Color", colorDefault ), styleNoTitle | ParamStyle("Price Style") | GetPriceStyle(), Null, Null, 0, 0 );
//_SECTION_END();

//_SECTION_BEGIN( "MPLite" );
// - there was a plot limit call introduced after 5.41.0 beta
//   i.e. "•Warning 502: Calling Plot()/PlotOHLC over 500 times is displayed in indicator in runtime to prevent abuse"
// - uses GFX for major calls of plot only if AB version newer than 5.40 - this only delays reaching the plot limit
// - see also the toggle parameter "use_original_version"

use_original_version = ParamToggle("MP version", "GFX code(only if AB > 5.40)|original code", 0);
percent = Param( "Value Area", 70, 1, 100, 1 );
Type = ParamToggle( "Type", "Price Profile|Volume Profile", 0 );
Period = ParamList( "Base", "Hourly|Daily|Weekly|Monthly|Lastthursday|Yearly", 1 );
x_scale = Param( "Horizontal_scale", 1, 0, 10, 0.1 );
EnMP2 = ParamStyle( "Style", styleLine | styleNoLabel, maskAll );

EnIB = ParamToggle( "Show Initial Balance",  "No|Yes", 1 );
IBBars = Param( "Initial Balance Bars", 2, 1, 10, 1 );
ViewYvalues = ParamToggle( "Show Yesterdays Values", "No|Yes", 1 );
ViewVlines = ParamToggle( "Show Vertical Base Lines", "No|Yes", 1 );
Viewvalues = ParamToggle( "Show Values", "No|Yes", 0 );
ViewVpoc = ParamToggle( "Show Virgin POC", "No|Yes", 1 );
ViewTPO = ParamToggle( "Show TPO Count", "No|Yes", 0 );

Color_Above_VA = ParamColor( "Color_Above_VA",  colorTan );
Color_VA = ParamColor( "Color_VA", colorBlueGrey );
Color_Below_VA = ParamColor( "Color_Below_VA", colorTan );
Color_POC_line = ParamColor( "Color_POC_Line", colorYellow );
color_YPOC = ParamColor( "YPOC", colorYellow );
Color_Virgin_POC = ParamColor( "Virgin Poc Color", colorYellow );
Color_Base_Line = ParamColor( "Base Line Color", colorDarkGrey );
Color_YVA = ParamColor( "YVA", colorLightBlue );
Transparency_YVA = Param( "YVA Transparency", 0.6, 0, 1, 0.01 );
Color_IB = ParamColor( "IB Color", colorGrey40 );
Transparency_IB = Param( "IB Transparency", 0.6, 0, 1, 0.01 );
Pen_Thickness = Param( "Line Thickness", 1, 1, 2 );

function Lastthursday() {
	Daysinmonth = IIf( Month() == 1 OR Month() == 3 OR Month() == 5 OR Month() == 7 OR Month() == 8 OR Month() == 10 OR Month() == 12, 31, 30 );
	Daysinmonthfeb = IIf( Year() % 4 == 0 AND Year() % 100 != 0, 29, 28 );
	Daysinmonthfinal = IIf( Month() == 2, Daysinmonthfeb, Daysinmonth );
	returnvalue = IIf( Daysinmonthfinal - Day() < 7 AND DayOfWeek() == 4, 1, IIf( Daysinmonthfinal - Day() < 8 AND DayOfWeek() == 3 AND Ref( DayOfWeek(), 1 ) != 4 AND Day() != Daysinmonthfinal , 1, 0 ) );
	return returnvalue;
}

procedure PlotlinewithGFXinit() {
	global AB_Miny, AB_Maxy, AB_lvb, AB_fvb;
	global AB_pxchartleft, AB_pxchartwidth, AB_pxchartbottom, AB_pxchartheight;
	global AB_TotalBars, AB_penwidth;

	RequestTimedRefresh(1);
	GfxSetOverlayMode( 0 );
	AB_penwidth = Pen_Thickness;

	AB_Miny = Status( "axisminy" );
	AB_Maxy = Status( "axismaxy" );
	AB_lvb = Status( "lastvisiblebar" );
	AB_fvb = Status( "firstvisiblebar" );

	AB_pxchartleft = Status( "pxchartleft" );
	AB_pxchartwidth = Status( "pxchartwidth" );
	AB_pxchartbottom = Status( "pxchartbottom" );
	AB_pxchartheight = Status( "pxchartheight" );

	AB_TotalBars = AB_Lvb - AB_fvb;
}

procedure Plot_horizon_line_with_GFX( ix0, ix1, iy, icolor ) {
	global AB_Miny, AB_Maxy, AB_lvb, AB_fvb;
	global AB_pxchartleft, AB_pxchartwidth, AB_pxchartbottom, AB_pxchartheight;
	global AB_TotalBars, AB_penwidth;

	local ix0, ix1, iy, icolor;
	local x_px, y_px, y_scale;

	GfxSelectPen( icolor, AB_penwidth, 0 );
	x_px = AB_pxchartleft + ( ix0 - AB_fvb ) * AB_pxchartwidth / ( AB_TotalBars + 1 );

	y_scale = AB_pxchartheight / ( AB_maxy - AB_miny );
	y_px = AB_pxchartbottom - floor( 0.5 + ( iy  - AB_Miny ) * y_scale );
	GfxMoveTo( x_px, y_px );

	x_px = AB_pxchartleft + ( ix1 - AB_fvb ) * AB_pxchartwidth / ( AB_TotalBars + 1 );
	GfxLineTo( x_px, y_px );
}

FirstVisibleBar = Status( "FirstVisibleBar" );
Lastvisiblebar = Status( "LastVisibleBar" );
totalVisible = Lastvisiblebar - FirstVisibleBar;

if ( Period == "Hourly" ) {
	BarsInDay = BarsSince( Hour() != Ref( Hour(), -1 ) );
	Bot = TimeFrameGetPrice( "L", inHourly, 0 );
	Top = TimeFrameGetPrice( "H", inHourly, 0 );
	Vol = TimeFrameGetPrice( "V", inHourly, 0 );
}

if ( Period == "Daily" ) {
	BarsInDay = BarsSince( Day() != Ref( Day(), -1 ) ) ;
	Bot = TimeFrameGetPrice( "L", inDaily, 0 );
	Top = TimeFrameGetPrice( "H", inDaily, 0 );
	Vol = TimeFrameGetPrice( "V", inDaily, 0 );
}

if ( Period == "Weekly" ) {
	BarsInDay = BarsSince( DayOfWeek() < Ref( DayOfWeek(), -1 ) );
	bot1 = ValueWhen( BarsInDay == 0, L, 1 );
	bot2 = ValueWhen( Ref( BarsInDay, 1 ) == 1 OR BarIndex() > BarCount - 2 , LLV( L, BarsInDay ), 0 );
	bot = Min( bot1, bot2 );
	top1 = ValueWhen( BarsInDay == 0, H, 1 );
	top2 = ValueWhen( Ref( BarsInDay, 1 ) == 1 OR BarIndex() > BarCount - 2, HHV( H, BarsInDay ), 0 );
	top = Max( top1, top2 );
	Vol = TimeFrameGetPrice( "V", inWeekly, 0 );
}

if ( Period == "Monthly"  OR Interval() == inDaily ) {
	BarsInDay = BarsSince( Month() != Ref( Month(), -1 ) );
	Bot = TimeFrameGetPrice( "L", inMonthly, 0 );
	Top = TimeFrameGetPrice( "H", inMonthly, 0 );
	Vol = TimeFrameGetPrice( "V", inMonthly, 0 );
}

if ( Period == "Lastthursday" ) {
	BarsInDay = BarsSince( Lastthursday() == 0 AND Ref( Lastthursday(), -1 ) == 1 );
	bot1 = ValueWhen( BarsInDay == 0, L, 1 );
	bot2 = ValueWhen( Ref( BarsInDay, 1 ) == 1 OR BarIndex() > BarCount - 2 , LLV( L, BarsInDay ), 0 );
	bot = Min( bot1, bot2 );
	top1 = ValueWhen( BarsInDay == 0, H, 1 );
	top2 = ValueWhen( Ref( BarsInDay, 1 ) == 1 OR BarIndex() > BarCount - 2, HHV( H, BarsInDay ), 0 );
	top = Max( top1, top2 );
	Vol = ValueWhen( Ref( BarsInDay, 1 ) == 1 OR BarIndex() > BarCount - 2 , Sum( V, BarsInDay ), 0 );
}

if ( Period == "Yearly" OR Interval() == inWeekly ) {
	BarsInDay = BarsSince( Year() != Ref( Year(), -1 ) );
	Bot = TimeFrameGetPrice( "L", inYearly, 0 );
	Top = TimeFrameGetPrice( "H", inYearly, 0 );
	Vol = TimeFrameGetPrice( "V", inYearly, 0 );
}

CurTop = HHV( H, BarsInDay + 1 );
Curbot = LLV( L, BarsInDay + 1 );
Range =  Top - Bot;
coverage = LastValue( Ref( ATR( 10 ), -1 ) );

den = ( coverage / 10 );

multiplier = IIf( round( totalVisible ) / 300 < 1, 1, round( totalVisible ) / 300 );

if ( ViewVlines == 1 ) {
	Plot( BarsInDay == 0, "", Color_Base_Line, styleHistogram | styleOwnScale | styleLine | styleNoLabel );
}

relTodayRange = 0;

x = 0;
basey = 0;
basex = 0;
newday = 0;
total = 0;
shiftup = 0;
shiftdn = 0;
Line = Null;
Voloumeunit = 0;

PlotlinewithGFXinit();
for (  i = IIf( FirstVisibleBar - 100 > 1, FirstVisibleBar - 100, FirstVisibleBar ); i < Lastvisiblebar AND i < BarCount - 1 ; i++  ) {
	if ( BarsInDay[i] == 0 ) {
		t = BarsInDay[i-1];
		if ( EnIB == 1 ) {
			IBH = HHV( H, IBBars );
			IBL = LLV( L, IBBars );
			Line1 = LineArray( basex , IBH[basex+IBBars-1], i, IBH[basex+IBBars-1] );
			Line2 = LineArray( basex , IBL[basex+IBBars-1], i, IBL[basex+IBBars-1] );
			PlotOHLC( Line1, Line1, Line2, Line2, "", ColorBlend( Color_IB, GetChartBkColor(), Transparency_IB ), styleNoLabel | styleCloud | styleNoRescale, Null, Null, 0, -1 );
		}

		poc = 0;
		pocj = 0;
		midrange = int( relTodayRange / 2 ) + 1;

		for ( j = 1; j <= relTodayRange + 1 ; j++ ) {
			if ( poc < x[j] ) {
				poc = x[j];
				pocj = j;
			}
			else if ( poc == x[j] ) {
				if ( abs( midrange - j ) < abs( midrange - pocj ) ) {
					poc = x[j];
					pocj = j;
				}
			}
		}

		for ( n = 1; n <= relTodayRange; n++ ) {
			total[n] = x[n] + total[n-1];
		}

		Value_area = ( total[relTodayRange] * percent ) / 100;

		for ( a = 1; a <= relTodayRange; a++ ) {
			if ( pocj - a > 0 AND pocj + a < relTodayRange ) {
				if ( poc + total[pocj+a] - total[pocj] + ( total[pocj] - poc ) - total[pocj-( a+1 )] >= Value_area ) {
					shiftup = a;
					shiftdn = a;
					break;
				}
			}
			else if ( pocj - a < 1 ) {
				if ( poc + total[pocj+a] - total[pocj] + ( total[pocj] - poc ) >= Value_area ) {
					shiftup = a;
					shiftdn = pocj;
					break;
				}
			}
			else if ( pocj + a > relTodayRange ) {
				if ( poc + total[relTodayRange] - total[pocj] + ( total[pocj] - poc ) - total[pocj-( a+1 )] >= Value_area ) {
					shiftup = floor( relTodayRange ) - pocj;
					shiftdn = a + 1;
					break;
				}
			}
		}

		if ( ViewVpoc == 1 ) {
			Virginpoc = basey + pocj * den;
			newi = Null;

			for ( j = i; j <= ( BarCount - 1 ) ; j++ ) {
				if ( L[j] < Virginpoc AND H[j] > Virginpoc ) {
					newi = j;
					break;
				}
				else {
					newi = BarCount;
				}
			}
			Plot( LineArray( basex[i], basey + pocj*den, newi, basey + pocj*den ), "", Color_Virgin_POC, styleLine | styleNoRescale );
		}

		Vah = LineArray( baseX[i], baseY + ( pocj + shiftup ) * den, i, baseY + ( pocj + shiftup ) * den );
		Val = LineArray( baseX[i], baseY + ( pocj - shiftdn ) * den, i, baseY + ( pocj - shiftdn ) * den );
		pocline = LineArray( basex, basey + pocj * den, basex[i] + poc, basey + pocj * den );

		Vahn = LineArray( i, baseY + ( pocj + shiftup ) * den, i + t , baseY + ( pocj + shiftup ) * den );
		pocn = LineArray( i, baseY + ( pocj ) * den, i + t, baseY + ( pocj ) * den );
		Valn = LineArray( i, baseY + ( pocj - shiftdn ) * den, i + t , baseY + ( pocj - shiftdn ) * den );

		if ( Version() > 5.4 && !use_original_version ) { // pocline
			Plot_horizon_line_with_GFX( baseX, basex[i] + poc, basey + pocj * den, Color_POC_Line );
		}
		else  {
			Plot( pocline, "", Color_POC_Line, styleLine | styleNoRescale | styleNoLabel );
		}

		if ( ViewYvalues == 1 ) {
			Plot( pocn, "", color_YPOC, styleDashed | styleNoRescale );
			PlotOHLC( Vahn, Vahn, Valn, Valn, "", ColorBlend( color_YVA, GetChartBkColor(), Transparency_YVA ), styleNoLabel | styleCloud | styleNoRescale, Null, Null, 0, -1 );

		}

		if ( ViewTPO == 1 ) {
			nnn = HHV( H, BarsInDay );
			PlotText( "" + ( total[relTodayRange] - total[pocj] ), basex[i], nnn[i], colorLightGrey );
			PlotText( "" + ( total[pocj-1] ), basex[i], basey - den, colorLightGrey );
		}

		if ( Viewvalues == 1 ) {
			PlotText( "" + round( ( basey + pocj*den ) ), baseX[i], basey + pocj*den, colorWhite, colorDarkGrey );
			PlotText( "" + round( ( baseY + ( pocj + shiftup )*den ) ), baseX[i], baseY + ( pocj + shiftup )*den, colorWhite, colorDarkGrey );
			PlotText( "" + round( ( baseY + ( pocj - shiftdn )*den ) ), baseX[i], baseY + ( pocj - shiftdn )*den, colorWhite, colorDarkGrey );
		}

		if ( Version() > 5.4 && !use_original_version ) {
			for ( p = 0; p <= relTodayRange + 1; p = p + multiplier ) {
				Plot_horizon_line_with_GFX( baseX, baseX + x[p], baseY + p * Den, IIf( p > ( pocj + shiftup ), Color_Above_VA, IIf( p <= ( pocj + shiftup ) AND p >= ( pocj - shiftdn ), IIf( x[p]-x_scale < 1, colorRed, Color_VA), Color_Below_VA )));
			}
		}
		else {
			for ( p = 0; p <= relTodayRange + 1; p = p + multiplier ) {
				if ( P > 0 ) {
					line = LineArray( baseX, baseY + ( p ) * Den, baseX + x[p], baseY + ( p ) * Den );
				}
				Plot( line, "", IIf( p > ( pocj + shiftup ), Color_Above_VA, IIf( p <= ( pocj + shiftup )AND p >= ( pocj - shiftdn ), Color_VA, Color_Below_VA ) ) , EnMP2 );
			}
		}

		///////////////////
		basex = 0;
		x = 0;
		Basex = i;
		baseY = Bot[i];
		relTodayRange = Range[i] / Den;
		Voloumeunit = Vol[i] / LastValue( BarsInDay );
	}

	for ( j = 0; j <= relTodayRange ; j++ ) {
		if ( L[i] <= Bot[i] + j*Den AND H[i] >= Bot[i] + j*Den  ) {
			if ( Type == 0 ) { // Price Profile
				x[j] = ( x[j] ) + x_scale;
			}
			else if ( Type == 1 ) { // Volume Profile
				x[j] = x[j] + round( V[i] / Voloumeunit ) + 1;
			}
		}
	}
}

if ( EnIB == 1 ) { // Initial Balance
	IBH = HHV( H, IBBars );
	IBL = LLV( L, IBBars );
	Line1 = LineArray( basex - 20, IBH[basex+IBBars-1], i, IBH[basex+IBBars-1] );
	Line2 = LineArray( basex - 20 , IBL[basex+IBBars-1], i, IBL[basex+IBBars-1] );
	PlotOHLC( Line1, Line1, Line2, Line2, "", ColorBlend( Color_IB, GetChartBkColor(), Transparency_IB ), styleNoLabel | styleCloud | styleNoRescale, Null, Null, 20, -1 );
}

//////////////////////////////////
poc = 0;
pocj = 0;
midrange = int( relTodayRange / 2 ) + 1;

for ( j = 1; j <= relTodayRange + 1 ; j++ ) {
	if ( poc < x[j] ) {
		poc = x[j];
		pocj = j;
	}
	else if ( poc == x[j] ) {
		if ( abs( midrange - j ) < abs( midrange - pocj ) ) {
			poc = x[j];
			pocj = j;
		}
	}
}

for ( n = 1; n <= relTodayRange; n++ ) {
	total[n] = x[n] + total[n-1];
}

Value_area = ( total[relTodayRange] * percent ) / 100;

for ( a = 1; a <= relTodayRange; a++ ) {
	if ( pocj - a > 0 AND pocj + a < relTodayRange ) {
		if ( poc + total[pocj+a] - total[pocj] + ( total[pocj] - poc ) - total[pocj-( a+1 )] >= Value_area ) {
			shiftup = a;
			shiftdn = a;
			break;
		}
	}
	else if ( pocj - a < 1 ) {
		if ( poc + total[pocj+a] - total[pocj] + ( total[pocj] - poc ) >= Value_area ) {
			shiftup = a;
			shiftdn = pocj;
			break;
		}
	}
	else if ( pocj + a > relTodayRange ) {
		if ( poc + total[relTodayRange] - total[pocj] + ( total[pocj] - poc ) - total[pocj-( a+1 )] >= Value_area ) {
			shiftup = floor( relTodayRange ) - pocj;
			shiftdn = a + 1;
			break;
		}
	}
}

Vah = LineArray( baseX[i], baseY + ( pocj + shiftup ) * den, i, baseY + ( pocj + shiftup ) * den );
Val = LineArray( baseX[i], baseY + ( pocj - shiftdn ) * den, i, baseY + ( pocj - shiftdn ) * den );
pocline = LineArray( basex, basey + pocj * den, basex[i] + poc, basey + pocj * den );

if ( ViewTPO == 1 ) {
	PlotText( "" + ( total[relTodayRange] - total[pocj] ), basex[i], top[i], colorLightGrey );
	PlotText( "" + ( total[pocj-1] + x_scale ), basex[i], basey - den, colorLightGrey );
}

if ( Viewvalues == 1 ) {
	PlotText( "" + round( ( basey + pocj*den ) ), baseX[i], basey + pocj*den, colorWhite, colorDarkGrey );
	PlotText( "" + round( ( baseY + ( pocj + shiftup )*den ) ), baseX[i], baseY + ( pocj + shiftup )*den, colorWhite, colorDarkGrey );
	PlotText( "" + round( ( baseY + ( pocj - shiftdn )*den ) ), baseX[i], baseY + ( pocj - shiftdn )*den, colorWhite, colorDarkGrey );
}

if ( Version() > 5.4 && !use_original_version ) {
	for ( p = 0; p <= relTodayRange + 1; p = p + multiplier ) {
		Plot_horizon_line_with_GFX( baseX, baseX + x[p], baseY + p * Den, IIf( p > ( pocj + shiftup ), Color_Above_VA, IIf( p <= ( pocj + shiftup ) AND p >= ( pocj - shiftdn ), Color_VA, Color_Below_VA )));
	}
	// pocline
	Plot_horizon_line_with_GFX( baseX, basex[i] + poc, basey + pocj * den, Color_POC_Line );
}
else {
	for ( p = 0; p <= relTodayRange + 1; p = p + multiplier ) {
		line = LineArray( baseX, baseY + p * Den, baseX + x[p], baseY + p * Den );
		Plot( line, "", IIf( p > ( pocj + shiftup ), Color_Above_VA, IIf( p <= ( pocj + shiftup )AND p >= ( pocj - shiftdn ), IIf( x[p]-x_scale < 1, colorRed, colorBlueGrey), Color_Below_VA ) ), EnMP2 );
	}
    Plot( pocline, "", Color_POC_Line, styleLine | styleNoRescale | styleNoLabel, Null, Null, 0 );
}
//_SECTION_END();
2nd Bigger Heavy Code -- might have compatibility issues
PHP:
_SECTION_BEGIN("VOLUME_Hight of Volume Bars Control");


PlotVOL = ParamToggle( "plot Volume?","No| Yes",1);

VolColor = (C>O OR (C==O AND (H-C)<=(C-L) ))*ParamColor( "VUpColor" ,5) +

(C<O OR (C==O AND
(H-C)>(C-L)) )*ParamColor( "VDnColor" ,4) ;

VolScale = Param("1/Vol. Height (TimeBar chart)(fraction of
window) 5=1/5=20%",10, 2, 100, 1.0) ; // Timebars

if (PlotVOL >0)

{

Vheight = VolScale;

Plot(Prec(Volume ,0),"V",VolColor,
//styleNoTitle| styleOwnScale| styleNoLabel| styleThick| (styleCandle| styleNoLabel) ,Vheight ); }
//Plot(MA(Volume,50),"",colorLightBlue,styleLine);

styleNoTitle| styleOwnScale| styleNoLabel| styleThick| ParamStyle( "VStyle", styleHistogram,maskHistogram| styleNoLabel) ,Vheight ); }
//Plot(MA(Volume,50),"",colorLightBlue,styleLine);


_SECTION_END();

_SECTION_BEGIN("Volume At Price");
PlotVAPOverlay(Param("lines", 1000, 100, 1000, 10), Param("Width", 30, 1, 100, 1), ParamColor("Color", colorBlue), ParamToggle("Side", "Left|Right", 1) | 4 *ParamToggle("Z-order", "On top|Behind", 0));

_SECTION_END();

_SECTION_BEGIN("MarketProfile");
//------------------------------------------------------------------------------
//
// Formula Name: Market Profile
//
// Use with 5/15min chart
// Originial - From AFL library

//Market Profile 9/19/2009

PlotOHLC(O,H,L,C,"Price",IIf(C>O,colorGreen,colorDarkRed),styleCandle);

SetChartBkColor(ParamColor("Outer Panel",colorPaleBlue));
SetChartBkGradientFill(ParamColor("Upper Chart",1),ParamColor("Lower Chart",23));


EnMP2= ParamList("MarketProfile","Solid|Lines|Letters");
styleLines = ParamStyle("Style", styleLine, maskAll);

Type=ParamList("Type","Price Profile|Volume Profile");
Period= ParamList("Base","Hourly|Daily|Weekly|Monthly",1);

Den = Param("Density", 1, 0.25, 100, 0.25); // Resolution in terms of $
percent=Param("Value Area", 70, 1, 100, 1);
ViewTPOCount= ParamToggle("Show TPO Count", "No|Yes",1);
Viewvalues= ParamToggle("Show Values", "No|Yes",1);

ViewPOC = ParamToggle("Show POC", "No|Yes",1);
ViewVALVAH = ParamToggle("Show VAL VAH Line", "No|Yes",1);
Viewfill = ParamToggle("Show VA Fill", "No|Yes",1);
Colorpoc=ParamColor("Color POC", colorYellow);
Colorfill=ParamColor("Color Fill", ColorRGB(20,40,60));


EnIB = ParamToggle("Show Initial Balance", "Yes|No");
IBBars = Param("Initial Balance Bars", 2, 0, 10, 1);

if(Period=="Daily"){
BarsInDay = BarsSince(Day() != Ref(Day(), -1));
Bot = TimeFrameGetPrice("L", inDaily, 0);
Top = TimeFrameGetPrice("H", inDaily, 0);
Vol = TimeFrameGetPrice("V", inDaily, 0);
}

if(Period=="Hourly"){
BarsInDay = BarsSince(Minute() != Ref(Minute(), -1));
Bot = TimeFrameGetPrice("L", in5Minute, 0);
Top = TimeFrameGetPrice("H", in5Minute, 0);
Vol = TimeFrameGetPrice("V", in5Minute, 0);
}

if(Period=="Weekly"){
BarsInDay = BarsSince(DayOfWeek() < Ref( DayOfWeek(), -1 ));
Bot = TimeFrameGetPrice("L", inWeekly, 0);
Top = TimeFrameGetPrice("H", inWeekly, 0);
Vol = TimeFrameGetPrice("V", inWeekly, 0);
}

if(Period=="Monthly" ){
BarsInDay = BarsSince(Month() != Ref(Month(), -1));
Bot = TimeFrameGetPrice("L", inMonthly, 0);
Top = TimeFrameGetPrice("H", inMonthly, 0);
Vol = TimeFrameGetPrice("V", inMonthly, 0);
}

CurTop = HHV(H,BarsInDay+1);
Curbot = LLV(L,BarsInDay+1);
Range = Highest(Top-Bot);
TodayRange = Top - Bot;

AveRange = Sum(Top-Bot,30)/30;
LAveRange = AveRange[BarCount-1];

// Initialization
baseX = 0;
baseY = floor(Bot[0]/Den)*Den;
relTodayRange = 0;
firstVisBar = Status("firstvisiblebar");
lastVisBar = Status("lastvisiblebar");

D=.0005;
total=0;
totaldn=0;
totalup=0;
shiftup=0;
shiftdn=0;
startr=0;

for (j=0; j <= 100; j++) {
x[j] = 0;
}

i0 = 0;
i1 = 0;
for (i=0; i<BarCount; i++) {
if (BarsInDay[i] == 0 AND i < firstVisBar) {
i0 = i;
}
if (BarsInDay[i] == 0 AND i >= lastVisBar) {
i1 = i;
}
}

i1 = BarCount-1;
for (i=i0; i<=i1; i++) {
if (BarsInDay[i] == 0) {
baseX = i;
baseY = floor(Bot[i]/Den)*Den;
maxY = floor(Top[i]/Den)*Den;
relTodayRange = (maxY-baseY)/Den;

for (j=0; j <= relTodayRange; j++) {
x[j] = 0;
}
}

range_x=lastVisBar-firstVisBar;
spread = Param("X Space", 80, 1, 200, 1);
tpl = Param("Time Per Letter (mins)", 30, 1, 360, 1);
Intervalmin=Interval()/60;
flt =Param("First Letter (Bars)", 1, 1, 60, 1);
teb=ParamToggle("To Each Bar","No|Yes");
Color=Param("Color Threshold",20,1,50,1);
stopg=0;
stopr=0;
new=0;

Voloumeunit=Vol[i]/LastValue(BarsInDay);


if (EnMP2 == "Letters") {
for (j=0; j<= relTodayRange; j++) {
if (L[i] <= baseY+j*Den AND H[i] >= baseY+j*Den) {
PlotText(StrExtract(" A , B , C , D , E , F , G , H , I , J , K , L , M , N , O , P , Q , R , S , T , U , V , W , X , Y , Z, a , b , c , d , e , f , g , h , i , j , k , L , m , n ,o , p , q , r , s , t , u , v , w , x , y , z ",
IIf(BarsInDay[i]<flt,0,ceil(BarsInDay[i]/(tpl/Intervalmin))-0)), baseX+IIf(teb==1,BarsInDay[i],x[j]*(range_x/spread)), baseY+j*Den,
colorWhite,ColorHSB(10+((ceil(BarsInDay[i]/(tpl/Intervalmin)))*Color),160,140));
x[j]++;

}
}
}

else if (EnMP2 == "Lines" OR EnMP2 == "Solid") {
for (j=0; j<= relTodayRange; j++) {
if (L[i] <= baseY+j*Den AND H[i] >= baseY+j*Den) {
if(Type=="Price Profile"){x[j]=x[j]+1;}
else if(Type=="Volume Profile"){x[j]=x[j]+round(V[i]/Voloumeunit);}

}
}
}

// Draw Initial Balance after 11am bar is complete
if (BarsInDay[i] == IBBars+1 AND EnIB == 0) {
Line1 = LineArray(i-2, curtop[i-1],i+7, curtop[i-1],0,True);
Plot(Line1,"",colorLightGrey,styleLine+styleDashed|styleNoRescale);
Line1 = LineArray(i-2, curbot[i-1],i+7, curbot[i-1],0,True);
Plot(Line1,"",colorLightGrey,styleLine+styleDashed|styleNoRescale);
}

// Examine x[j]
if ((i < BarCount - 1 AND BarsInDay[i+1] == 0) OR i == BarCount-1) {
maxXj = 0;
maxj = 0;
midrange = int(relTodayRange/2)+1;
for (j=0; j<= relTodayRange; j++) {
if (maxXj < x[j]) {
maxXj = x[j]; maxj = j; StaticVarSet("Maxj",j); new=j;
} else if ( MaxXj == x[j]) {
if (abs(midrange-j) < abs(midrange-StaticVarGet("Maxj"))) {
maxXj = x[j]; maxj = j; StaticVarSet("Maxj",j); new=j;
}
}
}
for ( n = 1; n <= relTodayRange; n++ ) {
total[n]=x[n]+total[n-1];
}
Value_area=(total[relTodayRange]*percent)/100;

for ( a = 1; a <= relTodayRange; a++ )
{
if(Maxj-a>0 AND Maxj+a<relTodayRange)
{
if(MaxXj+total[Maxj+a]-total[Maxj]+(total[maxj]-MaxXj)-total[Maxj-(a+1)]>=Value_area) {shiftup=a; shiftdn=a; break;}
}
else if(Maxj-a<1 )
{
if(MaxXj+total[Maxj+a]-total[Maxj]+(total[maxj]-MaxXj)>=Value_area){shiftup=a; shiftdn=maxj-1; break;}
}
else if(Maxj+a>relTodayRange )
{
if(MaxXj+total[relTodayRange]-total[Maxj]+(total[maxj]-MaxXj)-total[Maxj-(a+1)] >=Value_area){shiftup=relTodayRange-maxj; shiftdn=a; break;}
}
}

Vah = LineArray(baseX, baseY+(maxj+shiftup)*Den, i, baseY+(maxj+shiftup)*Den,0,True);
Val = LineArray(baseX, baseY+(maxj-shiftdn)*Den, i, baseY+(maxj-shiftdn)*Den,0,True);
poc = LineArray(baseX, baseY+maxj*Den, i, baseY+maxj*Den,0,True);
if(ViewVALVAH==1){Plot(Vah,"",ParamColor("Color_VA", colorBlueGrey),styleLine|styleNoRescale);
Plot(Val,"",ParamColor("Color_VA", colorLightBlue),styleLine|styleNoRescale);}
if(ViewPOC==1){Plot(poc,"",Colorpoc,styleLine|styleNoRescale);}
if(Viewvalues==1){PlotText(""+(baseY+(maxj+shiftup)*Den),i-5,baseY+(maxj+shiftup)*Den,colorWhite);
PlotText(""+(baseY+(maxj-shiftdn)*Den),i-5,baseY+(maxj-shiftdn)*Den,colorWhite);
if(ViewTPOCount==1){PlotText(""+(total[maxj]-MaxXj)+" / "+(total[maxj-shiftdn+1]),basex,bot[i]-(Top[i]-bot[i])*0.05,ParamColor("Color_Below_VA", colorGrey40));
PlotText(""+(total[relTodayRange]-total[maxj])+" / "+(total[relTodayRange]-total[maxj+shiftup]),basex,Top[i],ParamColor("Color_Above_VA", colorGrey40));
}


if(ViewPOC==1){PlotText(""+(baseY+maxj*Den),i-5,baseY+maxj*Den,Colorpoc);}}
}

if (i < BarCount - 1 AND BarsInDay[i+1] == 0 OR i == BarCount-1) {

for (p = 1; p < relTodayRange+1; p++){
line = LineArray(baseX, baseY+p*Den, baseX+x[p], baseY+p*Den);
line2 = LineArray(baseX, baseY+(p-1)*Den, baseX+x[p-1], baseY+(p-1)*Den);

if (EnMP2 == "Solid")
{
PlotOHLC( Line, Line, Line2, Line2, "",IIf(p>(maxj+shiftup),ParamColor("Color_Above_VA", colorGrey40),IIf(p<=(maxj+shiftup)AND p>(maxj-shiftdn),ParamColor("Color_VA", colorBlueGrey),ParamColor("Color_Below_VA", colorGrey40))) ,styleCloud|styleNoRescale|styleNoLabel);
}
if (EnMP2 == "Lines")
{
Plot(line,"",IIf(p>(maxj+shiftup),ParamColor("Color_Above_VA", colorGrey40),IIf(p<=(maxj+shiftup)AND p>(maxj-shiftdn),ParamColor("Color_VA", colorBlueGrey),ParamColor("Color_Below_VA", colorGrey40))) , styleLines|styleNoLabel);
}

}
if(Viewfill==1){PlotOHLC(Vah,Vah,Val,Val,"",Colorfill,styleCloud|styleNoRescale|styleNoLabel);}

}
}


_SECTION_END();
//==============================

DayH = TimeFrameGetPrice("H", inDaily, -1);// yesterdays high
DayL = TimeFrameGetPrice("L", inDaily, -1);//low
DayC = TimeFrameGetPrice("C", inDaily, -1);//close
DayO = TimeFrameGetPrice("O", inDaily);// current day open
HiDay = TimeFrameGetPrice("H", inDaily);
LoDay = TimeFrameGetPrice("L", inDaily);


Title =   Name() + " - " + EncodeColor(colorRed)+ Interval(2) + EncodeColor(colorWhite) +
 "  - " + Date() +" - "

+ "Vol= "+ WriteVal(V) +WriteIf ( V > MA(V,26) ,EncodeColor(colorGreen)+"  UP "+ (V/MA(V,26))*100 + " %", EncodeColor(colorRed)+"  DOWN "+ (V/MA(V,26))*100 + " %")+ EncodeColor(colorLightBlue)
+ EncodeColor(colorYellow)+   " Yesterday's High : "+ EncodeColor(colorWhite)+DayH + EncodeColor(colorYellow)+   "    Yesterday's Low : "+ EncodeColor(colorWhite)+DayL

+ EncodeColor(colorBrightGreen)+   "\n                  Hi: "+ EncodeColor(colorWhite)+H


+ EncodeColor(colorYellow)+   "\n       Op: "+ EncodeColor(colorWhite)+O+ EncodeColor(colorAqua)+   "   Cl: "+ EncodeColor(colorBrightGreen)+C
+ EncodeColor(colorRed)+   "\n                  Lo: "+ EncodeColor(colorWhite)+L

+" \n "

;Thanx you for ur efforts...
But both above codes not working !
I found this from a website . I tested it in my Amibroker and its working fine.
Code:
_SECTION_BEGIN("BACKGROUD LTRS");
SetChartOptions(0,chartShowArrows|chartShowDates);
GfxSetOverlayMode(0);
GfxSetTextAlign( 6 );// center alignment
GfxSetTextColor( ParamColor("Text Color", ColorHSB( 98, 119, 112 ) ));
GfxSetBkMode(0); // transparent
GfxSelectFont("Verdana", Status("pxheight")/20 );
GfxTextOut( Name(), Status("pxwidth")/2, Status("pxheight")/14 );
GfxSelectFont("Arial", Status("pxheight")/27 );
GfxTextOut( "http://www.justfintech.com", Status("pxwidth")/2, Status("pxheight")/1.15);
_SECTION_END();

PlotOHLC(O,H,L,C,"Price",IIf(C>O,colorGreen,colorRed),styleCandle);
_N(Title = StrFormat("{{NAME}} - {{INTERVAL}} {{DATE}} Open %g, Hi %g, Lo %g, Close %g (%.1f%%) {{VALUES}}", O, H, L, C, SelectedValue( ROC( C, 1 ) ) ));


_SECTION_BEGIN( "MPLite" );
// - there was a plot limit call introduced after 5.41.0 beta
//   i.e. "•Warning 502: Calling Plot()/PlotOHLC over 500 times is displayed in indicator in runtime to prevent abuse"
// - uses GFX for major calls of plot only if AB version newer than 5.40 - this only delays reaching the plot limit
// - see also the toggle parameter "use_original_version"

//PlotOHLC( O, H, L, C, "Price", IIf( C > O, colorGreen, colorRed ), styleCandle );
function Lastthursday()
{
    Daysinmonth = IIf( Month() == 1 OR Month() == 3 OR Month() == 5 OR Month() == 7 OR Month() == 8 OR Month() == 10 OR Month() == 12, 31, 30 );
    Daysinmonthfeb = IIf( Year() % 4 == 0 AND Year() % 100 != 0, 29, 28 );
    Daysinmonthfinal = IIf( Month() == 2, Daysinmonthfeb, Daysinmonth );
    returnvalue = IIf( Daysinmonthfinal - Day() < 7 AND DayOfWeek() == 4, 1, IIf( Daysinmonthfinal - Day() < 8 AND DayOfWeek() == 3 AND Ref( DayOfWeek(), 1 ) != 4 AND Day() != Daysinmonthfinal , 1, 0 ) );
    return returnvalue;
}

procedure PlotlinewithGFXinit()
{
    global AB_Miny, AB_Maxy, AB_lvb, AB_fvb;
    global AB_pxchartleft, AB_pxchartwidth, AB_pxchartbottom, AB_pxchartheight;
    global AB_TotalBars, AB_penwidth;

    RequestTimedRefresh(1);
    GfxSetOverlayMode( 0 );
    AB_penwidth = 2;

    AB_Miny = Status( "axisminy" );
    AB_Maxy = Status( "axismaxy" );
    AB_lvb = Status( "lastvisiblebar" );
    AB_fvb = Status( "firstvisiblebar" );

    AB_pxchartleft = Status( "pxchartleft" );
    AB_pxchartwidth = Status( "pxchartwidth" );
    AB_pxchartbottom = Status( "pxchartbottom" );
    AB_pxchartheight = Status( "pxchartheight" );

    AB_TotalBars = AB_Lvb - AB_fvb;
}

procedure Plot_horizon_line_with_GFX( ix0, ix1, iy, icolor )
{
    global AB_Miny, AB_Maxy, AB_lvb, AB_fvb;
    global AB_pxchartleft, AB_pxchartwidth, AB_pxchartbottom, AB_pxchartheight;
    global AB_TotalBars, AB_penwidth;

    local ix0, ix1, iy, icolor;
    local x_px, y_px, y_scale;

    GfxSelectPen( icolor, AB_penwidth, 0 );
    x_px = AB_pxchartleft + ( ix0 - AB_fvb ) * AB_pxchartwidth / ( AB_TotalBars + 1 );

    y_scale = AB_pxchartheight / ( AB_maxy - AB_miny );
    y_px = AB_pxchartbottom - floor( 0.5 + ( iy  - AB_Miny ) * y_scale );
    GfxMoveTo( x_px, y_px );

    x_px = AB_pxchartleft + ( ix1 - AB_fvb ) * AB_pxchartwidth / ( AB_TotalBars + 1 );
    GfxLineTo( x_px, y_px );
}


FirstVisibleBar = Status( "FirstVisibleBar" );
Lastvisiblebar = Status( "LastVisibleBar" );

totalVisible = Lastvisiblebar - FirstVisibleBar;
//if(totalVisible<1500){
use_original_version = ParamToggle("MP version", "GFX code(only if AB > 5.40)|original code", 0);
//Den = Param("Density", 1, 0.1, 10, 0.1);
percent = Param( "Value Area", 70, 1, 100, 1 );
Type = ParamList( "Type", "Price Profile|Volume Profile" );
Period = ParamList( "Base", "Hourly|Daily|Weekly|Monthly|Lastthursday|Yearly", 1 );
x_scale = Param( "Horizontal_scale", 2, 0, 10, 0.1 );
EnMP2 = ParamStyle( "Style", styleLine | styleNoLabel, maskAll );
styleLines = styleDots;
EnIB = ParamToggle( "Show Initial Balance",  "No|Yes", 0 );
IBBars = Param( "Initial Balance Bars", 2, 1, 10, 1 );
ViewYvalues = ParamToggle( "Show Yesterdays Values", "No|Yes", 1 );
ViewVlines = ParamToggle( "Show Vertical Base Lines", "No|Yes", 1 );
Viewvalues = ParamToggle( "Show Values", "No|Yes", 0 );
ViewVpoc = ParamToggle( "Show Virgin POC", "No|Yes", 1 );
ViewTPO = ParamToggle( "Show TPO Count", "No|Yes", 0 );

Color_Above_VA = ParamColor( "Color_Above_VA",  colorGrey40 );
Color_VA = ParamColor( "Color_VA", colorBlueGrey );
Color_Below_VA = ParamColor( "Color_Below_VA", colorGrey40 );
Color_POC_line = ParamColor( "Color_POC_Line", colorYellow );

color_YVAH = ParamColor( "YVAH", colorWhite );
color_YVAL = ParamColor( "YVAL", colorWhite );
color_YPOC = ParamColor( "YPOC", colorYellow );

IBColor = ParamColor( "IB Color", colorWhite );
IBstyle = ParamStyle( "IB style", styleLine, maskAll );
Color_Virgin_POC = ParamColor( "Virgin Poc Color", colorYellow );
Color_Base_Line = ParamColor( "Base Line Color", colorDarkGrey );

if ( Period == "Hourly" )
{
    BarsInDay = BarsSince( Hour() != Ref( Hour(), -1 ) );
    Bot = TimeFrameGetPrice( "L", inHourly, 0 );
    Top = TimeFrameGetPrice( "H", inHourly, 0 );
    Vol = TimeFrameGetPrice( "V", inHourly, 0 );
}

if ( Period == "Daily" )
{
    //OR Interval()==3600
    BarsInDay = BarsSince( Day() != Ref( Day(), -1 ) ) ;
    Bot = TimeFrameGetPrice( "L", inDaily, 0 );
    Top = TimeFrameGetPrice( "H", inDaily, 0 );
    Vol = TimeFrameGetPrice( "V", inDaily, 0 );
}

if ( Period == "Weekly" OR Interval() == 24 * 3600 )
{
    BarsInDay = BarsSince( DayOfWeek() < Ref( DayOfWeek(), -1 ) );
    bot1 = ValueWhen( BarsInDay == 0, L, 1 );
    Bot2 = ValueWhen( Ref( BarsInDay, 1 ) == 1 OR BarIndex() > BarCount - 2 , LLV( L, BarsInDay ), 0 );
    bot = Min( bot1, bot2 );
    top1 = ValueWhen( BarsInDay == 0, H, 1 );
    Top2 = ValueWhen( Ref( BarsInDay, 1 ) == 1 OR BarIndex() > BarCount - 2, HHV( H, BarsInDay ), 0 );
    top = Max( top1, top2 );
    Vol = TimeFrameGetPrice( "V", inWeekly, 0 );
}

if ( Period == "Monthly"  )
{
    BarsInDay = BarsSince( Month() != Ref( Month(), -1 ) );
    Bot = TimeFrameGetPrice( "L", inMonthly, 0 );
    Top = TimeFrameGetPrice( "H", inMonthly, 0 );
    Vol = TimeFrameGetPrice( "V", inMonthly, 0 );
}

if ( Period == "Lastthursday"  )
{
    BarsInDay = BarsSince( Lastthursday() == 0 AND Ref( Lastthursday(), -1 ) == 1 );
    bot1 = ValueWhen( BarsInDay == 0, L, 1 );
    Bot2 = ValueWhen( Ref( BarsInDay, 1 ) == 1 OR BarIndex() > BarCount - 2 , LLV( L, BarsInDay ), 0 );
    bot = Min( bot1, bot2 );
    top1 = ValueWhen( BarsInDay == 0, H, 1 );
    Top2 = ValueWhen( Ref( BarsInDay, 1 ) == 1 OR BarIndex() > BarCount - 2, HHV( H, BarsInDay ), 0 );
    top = Max( top1, top2 );
    Vol = ValueWhen( Ref( BarsInDay, 1 ) == 1 OR BarIndex() > BarCount - 2 , Sum( V, BarsInDay ), 0 );

}

if ( Period == "Yearly"  )
{
    BarsInDay = BarsSince( Year() != Ref( Year(), -1 ) );
    Bot = TimeFrameGetPrice( "L", inYearly, 0 );
    Top = TimeFrameGetPrice( "H", inYearly, 0 );
    Vol = TimeFrameGetPrice( "V", inYearly, 0 );
}

CurTop = HHV( H, BarsInDay + 1 );

Curbot = LLV( L, BarsInDay + 1 );

Range =  Top - Bot;
coverage = LastValue( Ref( ATR( 10 ), -1 ) );

den = ( coverage / 10 );
//den=1;

multiplier = IIf( round( totalVisible ) / 300 < 1, 1, round( totalVisible ) / 300 );

if ( ViewVlines == 1 )
{

    Plot( BarsInDay == 0, "", Color_Base_Line, styleHistogram | styleOwnScale | styleLine | styleNoLabel );
}

relTodayRange = 0;

x = 0;
basey = 0;
basex = 0;
newday = 0;
total = 0;
shiftup = 0;
shiftdn = 0;
Line = Null;
Voloumeunit = 0;

PlotlinewithGFXinit();
for (  i = IIf( FirstVisibleBar - 100 > 1, FirstVisibleBar - 100, FirstVisibleBar ); i < Lastvisiblebar AND i < BarCount - 1 ; i++  )
{
    if ( BarsInDay[i] == 0 )
    {
        t = BarsInDay[i-1];


        if ( EnIB == 1 )
        {
            IBH = HHV( H, IBBars );
            IBL = LLV( L, IBBars );
            Line1 = LineArray( basex, IBH[basex+IBBars-1], i, IBH[basex+IBBars-1] );
            Plot( Line1, "", IBColor, IBstyle );
            Line2 = LineArray( basex, IBL[basex+IBBars-1], i, IBL[basex+IBBars-1] );
            Plot( Line2, "", IBcolor, IBstyle );
        }

        //////////////////////////////////
        poc = 0;
        pocj = 0;
        midrange = int( relTodayRange / 2 ) + 1;

        for ( j = 1; j <= relTodayRange + 1 ; j++ )
        {
            if ( poc < x[j] )
            {
                poc = x[j];
                pocj = j;
            }
            else
                if ( poc == x[j] )
                {
                    if ( abs( midrange - j ) < abs( midrange - pocj ) )
                    {
                        poc = x[j];
                        pocj = j;
                    }
                }

        }

        for ( n = 1; n <= relTodayRange; n++ )
        {
            total[n] = x[n] + total[n-1];
        }

        Value_area = ( total[relTodayRange] * percent ) / 100;

        for ( a = 1; a <= relTodayRange; a++ )
        {
            if ( pocj - a > 0 AND pocj + a < relTodayRange )
            {
                if ( poc + total[pocj+a] - total[pocj] + ( total[pocj] - poc ) - total[pocj-( a+1 )] >= Value_area )
                {
                    shiftup = a;
                    shiftdn = a;
                    break;
                }
            }
            else
                if ( pocj - a < 1 )
                {
                    if ( poc + total[pocj+a] - total[pocj] + ( total[pocj] - poc ) >= Value_area )
                    {
                        shiftup = a;
                        shiftdn = pocj;
                        break;
                    }
                }
                else
                    if ( pocj + a > relTodayRange )
                    {
                        if ( poc + total[relTodayRange] - total[pocj] + ( total[pocj] - poc ) - total[pocj-( a+1 )] >= Value_area )
                        {
                            shiftup = floor( relTodayRange ) - pocj;
                            shiftdn = a + 1;
                            break;
                        }
                    }
        }


        if ( ViewVpoc == 1 )
        {
            Virginpoc = basey + pocj * den;
            newi = Null;

            for ( j = i; j <= ( BarCount - 1 ) ; j++ )
                if ( L[j] < Virginpoc AND H[j] > Virginpoc )
                {
                    newi = j;
                    break;
                }
                else
                {
                    newi = BarCount;
                }

            Plot( LineArray( basex[i], basey + pocj*den, newi, basey + pocj*den ), "", Color_Virgin_POC, styleLine | styleNoRescale );
        }

        Vah = LineArray( baseX[i], baseY + ( pocj + shiftup ) * den, i, baseY + ( pocj + shiftup ) * den );
        Val = LineArray( baseX[i], baseY + ( pocj - shiftdn ) * den, i, baseY + ( pocj - shiftdn ) * den );
        pocline = LineArray( basex, basey + pocj * den, basex[i] + poc, basey + pocj * den );


        Vahn = LineArray( i, baseY + ( pocj + shiftup ) * den, i + t, baseY + ( pocj + shiftup ) * den );
        pocn = LineArray( i, baseY + ( pocj ) * den, i + t, baseY + ( pocj ) * den );
        Valn = LineArray( i, baseY + ( pocj - shiftdn ) * den, i + t, baseY + ( pocj - shiftdn ) * den );

        if ( Version() > 5.4 && !use_original_version )
        {
            // pocline
            Plot_horizon_line_with_GFX( baseX, basex[i] + poc, basey + pocj * den, Color_POC_Line );
        }
        else
        {
            Plot( pocline, "", Color_POC_Line, styleLine | styleNoRescale | styleNoLabel );
        }

        if ( ViewYvalues == 1 )
        {
            Plot( Vahn, "", color_YVAH, styleDashed | styleNoRescale );
            Plot( Valn, "", color_YVAL, styleDashed | styleNoRescale );
            Plot( pocn, "", color_YPOC, styleDashed | styleNoRescale );
        }


        if ( ViewTPO == 1 )
        {
            nnn = HHV( H, BarsInDay );
            PlotText( "" + ( total[relTodayRange] - total[pocj] ), basex[i], nnn[i], colorLightGrey );
            PlotText( "" + ( total[pocj-1] ), basex[i], basey - den, colorLightGrey );
        }

        if ( Viewvalues == 1 )
        {
            PlotText( "" + ( ( basey + pocj*den ) ), baseX[i], basey + pocj*den, colorWhite, colorDarkGrey );
            PlotText( "" + ( ( baseY + ( pocj + shiftup )*den ) ), baseX[i], baseY + ( pocj + shiftup )*den, colorWhite, colorDarkGrey );
            PlotText( "" + ( ( baseY + ( pocj - shiftdn )*den ) ), baseX[i], baseY + ( pocj - shiftdn )*den, colorWhite, colorDarkGrey );
        }


        if ( Version() > 5.4 && !use_original_version )
        {
            for ( p = 0; p <= relTodayRange + 1; p = p + multiplier )
            {
		         Plot_horizon_line_with_GFX( baseX, baseX + x[p], baseY + p * Den, IIf( p > ( pocj + shiftup ), Color_Above_VA, IIf( p <= ( pocj + shiftup ) AND p >= ( pocj - shiftdn ), Color_VA, Color_Below_VA )));
            }
        }
        else
        {
            for ( p = 0; p <= relTodayRange + 1; p = p + multiplier )
            {
                if ( P > 0 )
                {
                    line = LineArray( baseX, baseY + ( p ) * Den, baseX + x[p], baseY + ( p ) * Den );
                }
                Plot( line, "", IIf( p > ( pocj + shiftup ), Color_Above_VA, IIf( p <= ( pocj + shiftup )AND p >= ( pocj - shiftdn ), Color_VA, Color_Below_VA ) ) , EnMP2 );
            }
        }

///////////////////
        basex = 0;
        x = 0;
        Basex = i;
        baseY = Bot[i];
        relTodayRange = Range[i] / Den;
        Voloumeunit = Vol[i] / LastValue( BarsInDay );

    }

    for ( j = 0; j <= relTodayRange ; j++ )
    {
        if ( L[i] <= Bot[i] + j*Den AND H[i] >= Bot[i] + j*Den  )
        {

            if ( Type == "Price Profile" )
            {
                x[j] = ( x[j] ) + x_scale;
            }
            else
                if ( Type == "Volume Profile" )
                {
                    x[j] = x[j] + round( V[i] / Voloumeunit ) + 1;
                }

        }
    }
}


if ( EnIB == 1 )
{
    IBH = HHV( H, IBBars );
    IBL = LLV( L, IBBars );
    Line1 = LineArray( basex, IBH[basex+IBBars-1], i, IBH[basex+IBBars-1] );
    Plot( Line1, "", IBColor, IBstyle );
    Line2 = LineArray( basex, IBL[basex+IBBars-1], i, IBL[basex+IBBars-1] );
    Plot( Line2, "", IBColor, IBstyle );
}

//////////////////////////////////
poc = 0;
pocj = 0;
midrange = int( relTodayRange / 2 ) + 1;

for ( j = 1; j <= relTodayRange + 1 ; j++ )
{
    if ( poc < x[j] )
    {
        poc = x[j];
        pocj = j;
    }
    else
        if ( poc == x[j] )
        {
            if ( abs( midrange - j ) < abs( midrange - pocj ) )
            {
                poc = x[j];
                pocj = j;
            }
        }

}

for ( n = 1; n <= relTodayRange; n++ )
{
    total[n] = x[n] + total[n-1];
}

Value_area = ( total[relTodayRange] * percent ) / 100;


for ( a = 1; a <= relTodayRange; a++ )
{
    if ( pocj - a > 0 AND pocj + a < relTodayRange )
    {
        if ( poc + total[pocj+a] - total[pocj] + ( total[pocj] - poc ) - total[pocj-( a+1 )] >= Value_area )
        {
            shiftup = a;
            shiftdn = a;
            break;
        }
    }
    else
        if ( pocj - a < 1 )
        {
            if ( poc + total[pocj+a] - total[pocj] + ( total[pocj] - poc ) >= Value_area )
            {
                shiftup = a;
                shiftdn = pocj;
                break;
            }
        }
        else
            if ( pocj + a > relTodayRange )
            {
                if ( poc + total[relTodayRange] - total[pocj] + ( total[pocj] - poc ) - total[pocj-( a+1 )] >= Value_area )
                {
                    shiftup = floor( relTodayRange ) - pocj;
                    shiftdn = a + 1;
                    break;
                }
            }
}

Vah = LineArray( baseX[i], baseY + ( pocj + shiftup ) * den, i, baseY + ( pocj + shiftup ) * den );
Val = LineArray( baseX[i], baseY + ( pocj - shiftdn ) * den, i, baseY + ( pocj - shiftdn ) * den );
pocline = LineArray( basex, basey + pocj * den, basex[i] + poc, basey + pocj * den );

if ( ViewTPO == 1 )
{
    PlotText( "" + ( total[relTodayRange] - total[pocj] ), basex[i], top[i], colorLightGrey );
    PlotText( "" + ( total[pocj-1] + x_scale ), basex[i], basey - den, colorLightGrey );
}

if ( Viewvalues == 1 )
{
    PlotText( "" + ( ( basey + pocj*den ) ), baseX[i], basey + pocj*den, colorWhite, colorDarkGrey );
    PlotText( "" + ( ( baseY + ( pocj + shiftup )*den ) ), baseX[i], baseY + ( pocj + shiftup )*den, colorWhite, colorDarkGrey );
    PlotText( "" + ( ( baseY + ( pocj - shiftdn )*den ) ), baseX[i], baseY + ( pocj - shiftdn )*den, colorWhite, colorDarkGrey );
}


if ( Version() > 5.4 && !use_original_version )
{
    for ( p = 0; p <= relTodayRange + 1; p = p + multiplier )
    {
		Plot_horizon_line_with_GFX( baseX, baseX + x[p], baseY + p * Den, IIf( p > ( pocj + shiftup ), Color_Above_VA, IIf( p <= ( pocj + shiftup ) AND p >= ( pocj - shiftdn ), Color_VA, Color_Below_VA )));
    }
    // pocline
    Plot_horizon_line_with_GFX( baseX, basex[i] + poc, basey + pocj * den, Color_POC_Line );
}
else
{
    for ( p = 0; p <= relTodayRange + 1; p = p + multiplier )
    {
        line = LineArray( baseX, baseY + p * Den, baseX + x[p], baseY + p * Den );
        Plot( line, "", IIf( p > ( pocj + shiftup ), Color_Above_VA, IIf( p <= ( pocj + shiftup )AND p >= ( pocj - shiftdn ), Color_VA, Color_Below_VA ) ), EnMP2 );
    }

    Plot( pocline, "", Color_POC_Line, styleLine | styleNoRescale | styleNoLabel );
}
_SECTION_END();

_SECTION_BEGIN("Gradient Backfill");
SetChartBkGradientFill( ParamColor("Bg Top", ColorRGB( 255,255,255 )),

ParamColor("BgBottom", ColorRGB( 255,255,255 )),ParamColor("titleblock",ColorRGB( 255,255,255 )));
_SECTION_END();

_SECTION_BEGIN("Volume At Price");
PlotVAPOverlay( Param("Lines", 500, 100, 1000, 1 ), Param("Width", 12, 1, 100, 1 ), ParamColor("Color", colorGrey40 ), ParamToggle("Side", "Left|Right" ) | 4*ParamToggle("Z-order", "On top|Behind", 0 ) );

_SECTION_END();

_SECTION_BEGIN("VWAP");
/*
The VWAP for a stock is calculated by adding the value traded for every transaction in that stock ("price" x "number of  shares traded") and dividing the total shares traded. A VWAP is computed from the Open of the market to the market Close, AND is calculated by Volume weighting all transactions during this time period
*/

if(Period=="Daily" )
{//OR Interval()==3600
Bars_so_far_today = 1 + BarsSince( Day() != Ref(Day(), -1));
StartBar = ValueWhen(TimeNum() == 090000, BarIndex());
TodayVolume = Sum(V,Bars_so_far_today);
IIf (BarIndex() >= StartBar, VWAP = Sum (C * V, Bars_so_far_today  ) / TodayVolume,0);
}

if(Period=="Weekly" OR Interval()==24 * 3600 )
{
Bars_so_far_today = 1 + BarsSince(DayOfWeek() < Ref( DayOfWeek(), -1 ));
StartBar = ValueWhen(TimeNum() == 090000, BarIndex());
Vol = TimeFrameGetPrice("V", inWeekly, 0);
TodayVolume = Sum(Vol,Bars_so_far_today);
IIf (BarIndex() >= StartBar, VWAP = Sum (C * Vol, Bars_so_far_today  ) / TodayVolume,0);
}

if(Period=="Monthly"  )
{
Bars_so_far_today = 1 + BarsSince(Month() != Ref(Month(), -1));
Vol = TimeFrameGetPrice("V", inMonthly, 0);
StartBar = ValueWhen(TimeNum() == 090000, BarIndex());
TodayVolume = Sum(Vol,Bars_so_far_today);
IIf (BarIndex() >= StartBar, VWAP = Sum (C * Vol, Bars_so_far_today  ) / TodayVolume,0);
}

Plot (VWAP, "Vwap",colorYellow);
_SECTION_END();Hi Everyone,
I am the co-founder of the first Indian Advanced Charting platform GoCharting focused on Orderflow. We are the first platform on the "web" in the world which has successfully deployed Market Profile Charts (TPO) along with Volume Profile (VP) for Indian markets (cash for now). We recently started our dedicated thread in TJ (in fact yesterday was our first day in TJ)
URL: https://gocharting.com
https://www.traderji.com/community/threads/gocharting-the-first-and-only-indian-advanced-charting-and-orderflow-platform-on-the-web.107973/

Our focus is to disrupt the industry that sells orderflow tools to Indian retail audience at eye popping prices. Soliciting feedback and engagement from the users of this forum. Hope to address your queries on the original GoCharting thread (above) and to have in our charting platform
Cheers
I am the co-founder of the first Indian Advanced Charting platform GoCharting focused on Orderflow. We are the first platform on the "web" in the world which has successfully deployed Market Profile Charts (TPO) along with Volume Profile (VP) for Indian markets (cash for now). We recently started our dedicated thread in TJ (in fact yesterday was our first day in TJ)
URL: https://gocharting.com
https://www.traderji.com/community/threads/gocharting-the-first-and-only-indian-advanced-charting-and-orderflow-platform-on-the-web.107973/
Our focus is to disrupt the industry that sells orderflow tools to Indian retail audience at eye popping prices. Soliciting feedback and engagement from the users of this forum. Hope to address your queries on the original GoCharting thread (above) and to have in our charting platform
Cheers
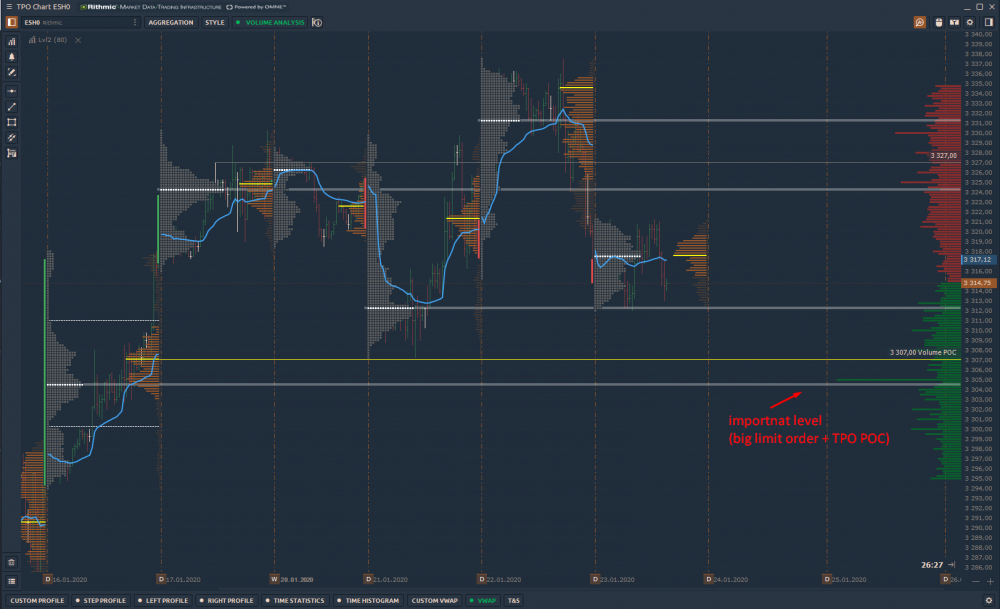
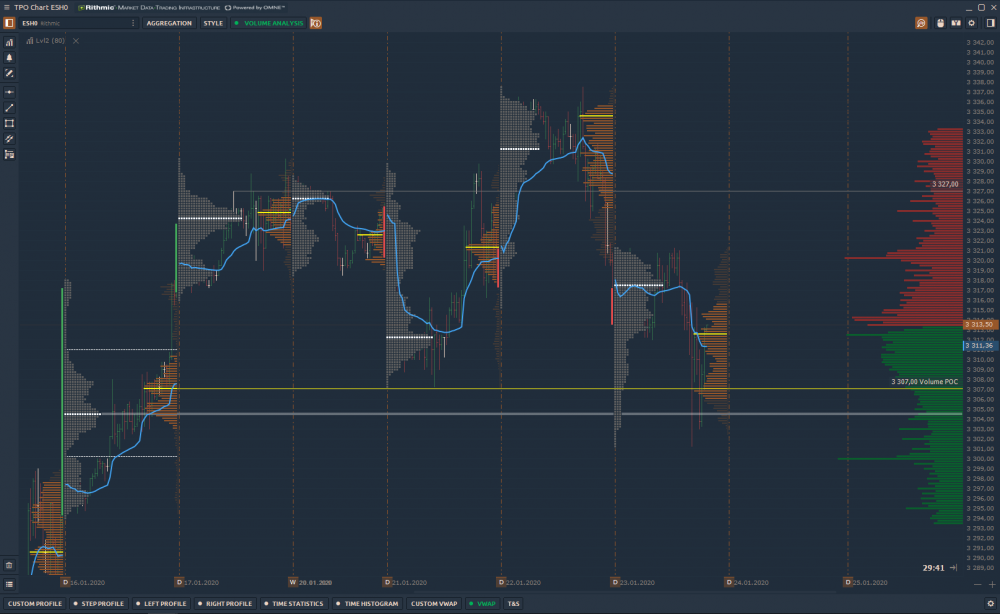

| Thread starter | Similar threads | Forum | Replies | Date |
|---|---|---|---|---|
| A | Best market profile teacher in India | Day Trading | 1 | |
| B | Any market profile traders here? | General Trading & Investing Chat | 1 | |
| H | how to create Market Profile chart TPO | Beginners Guide | 7 | |
| H | Data for Market profile TPO chart | Data Feeds | 0 | |
| H | market profile charting | Software | 3 |