Help Required for converting Repainting AFL to Non Repainting AFL
This is a repainting AFL, i want this AFL to be Non-Repainting.
Please Help
Here's the code
_SECTION_BEGIN("Realtimetips ");
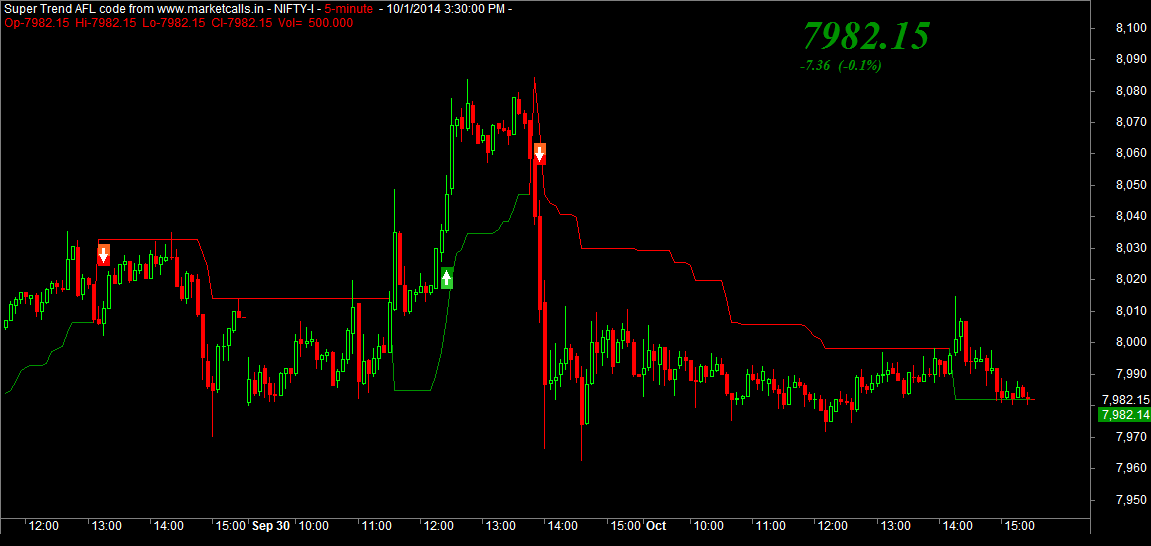
SetChartOptions(0,chartShowArrows|chartShowDates);
_N(Title = StrFormat("{{NAME}} - {{INTERVAL}} {{DATE}} Open %g, Hi %g, Lo %g, Close %g (%.1f%%) {{VALUES}}", O, H, L, C, SelectedValue( ROC( C, 1 ) ) ));
Plot( C, "Close", colorBlack , styleNoTitle | styleCandle | GetPriceStyle() );
//
messageboard = ParamToggle("Message Board","Show|Hide",0);
showsl = ParamToggle("Stop Loss Line", "Show|Hide", 0);
no=10;
res=HHV(H,no);
sup=LLV(L,no);
avd=IIf(C>Ref(res,-1),1,IIf(C<Ref(sup,-1),-1,0));
avn=ValueWhen(avd!=0,avd,1);
s5d=IIf(avn==1,sup,res);
if (showsl == 0)
{Plot(s5d,"Stop Loss",colorCustom14,styleDots);}
exitlong = Cross(s5d, C);
PlotShapes(exitlong * shapeDownArrow, colorRed,0,H,-12);
exitshort = Cross(C, s5d);
PlotShapes(exitshort * shapeUpArrow, colorGreen,0,L,-12);
Buy = exitshort;
Sell = exitlong;
Short = Sell;
Cover = Buy;
Buy = ExRem(Buy,Sell);
Sell = ExRem(Sell,Buy);
Short = ExRem(Short, Cover);
Cover = ExRem(Cover, Short);
AlertIf( Buy, "EMAIL", "BUY @ " + C, 1 );
AlertIf( Sell, "EMAIL", "SELL @ " + C, 2 );
for(i=BarCount-1;i>1;i--)
{
if(Buy == 1)
{
entry = C;
sig = "BUY";
sl = s5d;
tar1 = entry + (entry * .0078);
tar2 = entry + (entry * .0234);
tar3 = entry + (entry * .0356);
bars = i;
i = 0;
}
if(Sell == 1)
{
sig = "SELL";
entry = C;
sl = s5d;
tar1 = entry - (entry * .0078);
tar2 = entry - (entry * .0234);
tar3 = entry - (entry * .0356);
bars = i;
i = 0;
}
}
Offset = 20;
Clr = IIf(sig == "BUY", colorLime, colorOrange);
ssl = IIf(bars == BarCount-1, s5d[BarCount-1], Ref(s5d, -1));
sl = ssl[BarCount-1];
Plot(LineArray(bars-Offset, tar1, BarCount, tar1,1), "", Clr, styleLine|styleDots, Null, Null, Offset);
Plot(LineArray(bars-Offset, tar2, BarCount, tar2,1), "", Clr, styleLine|styleDots, Null, Null, Offset);
Plot(LineArray(bars-Offset, tar3, BarCount, tar3,1), "", Clr, styleLine|styleDots, Null, Null, Offset);
Plot(LineArray(bars-Offset, sl, BarCount, sl,1), "", colorCustom14, styleLine|styleDots, Null, Null, Offset);
Plot(LineArray(bars-Offset, entry, BarCount, entry,1), "", colorTurquoise, styleLine|styleDots, Null, Null, Offset);
for (i=bars; i <BarCount;i++)
{
PlotText("" + sig + " @ " + entry, BarCount+3, entry, Null, colorTurquoise);
PlotText("Target 1 : " + tar1, BarCount+3, tar1, Null, Clr);
PlotText("Target 2 : @ " + tar2, BarCount+3, tar2, Null, Clr);
PlotText("Target 3 : @ " + tar3, BarCount+3, tar3, Null, Clr);
PlotText("Trailing SL @ " + sl, BarCount+3, sl, Null, colorCustom14);
}
//Plot(sl, "", colorCustom14, styleLine);
printf("Last " + sig + " Signal came " + (BarCount-bars) + " bars ago");
printf("\n" + sig + " @ : " + entry + "\nStop Loss : " + sl + " (" + WriteVal(IIf(sig == "SELL",entry-sl,sl-entry), 2.2) + ")"+ "\nTarget_1 : " + tar1 + "\nTarget_2 : " + tar2 + "\nTarget_3 : " + tar3);
printf("\nCurrent P/L : " + WriteVal(IIf(sig == "BUY",(C-entry),(entry-C)),2.2));
if (messageboard == 0 )
{
GfxSelectFont( "Tahoma", 13, 100 );
GfxSetBkMode( 1 );
GfxSetTextColor( colorWhite );
if ( sig =="BUY")
{
GfxSelectSolidBrush( colorGreen ); // this is the box background color
}
else
{
GfxSelectSolidBrush( colorRed ); // this is the box background color
}
pxHeight = Status( "pxchartheight" ) ;
xx = Status( "pxchartwidth");
Left = 1100;
width = 310;
x = 2;
x2 = 290;
y = pxHeight;
GfxSelectPen( colorLightBlue, 1); // broader color
GfxRoundRect( x, y - 163, x2, y , 7, 7 ) ;
GfxTextOut( (" ......................................."),27,y-160);
GfxTextOut( ("Last " + sig + " Signal came " + (BarCount-bars-1) * Interval()/60 + " mins ago"), 13, y-140) ; // The text format location
GfxTextOut( ("" + WriteIf(sig =="BUY",sig + " @ ",sig + " @") + " : " + entry), 13, y-120);
GfxTextOut( ("Trailing SL : " + sl + " (" + WriteVal(IIf(sig == "SELL",entry-sl,sl-entry), 2.2) + ")"), 13, y-100);
GfxTextOut( ("Target:1 : " + tar1), 13, y -80);
GfxTextOut( ("Target:2 : " + tar2), 13,y-60);
GfxTextOut( ("Target:3 : " + tar3), 13,y-40);
GfxTextOut( ("Current P/L : " + WriteVal(IIf(sig == "BUY",(C-entry),(entry-C)),2.2)), 13, y-22);;
x = 290;
x2 = 570;
GfxSelectSolidBrush( colorTurquoise );
GfxSetTextColor( colorBlack);
GfxSelectFont( "Tahoma", 14, 100 );
GfxSetBkMode( 1 );
GfxSelectPen( colorLightBlue, 1); // broader color
GfxRoundRect( x, y - 43, x2, y , 7, 7 ) ;
GfxSelectFont( "Tahoma", 10, 400 );
}
//
function PlotDT()
{
displacement = Param("Displacement Value", 12, 1, 100, 1);
slmode = ParamToggle("Stop Loss", "Auto|Manual", 1);
width = ParamToggle("Width", "HL|OC", 1);
Count = Param("No. of DTL", 4, 4, 20, 1);
NewDay = Day()!= Ref(Day(), -1);
for (i=BarCount-1;i > 1; i--)
{
if(NewDay == 1)
{
printf("High : " + i);
if(width == 1)
{
DL = IIf(O < C, O, C);
DH = IIf(O > C, O, C);
}
else
{
DL = L;
DH = H;
}
Bars = i;
i = -1;
}
}
if(slmode==1)
{
distance = displacement;
}
else
{
distance = ((DH+DL)/2) * .01;
}
Plot(LineArray(BarCount - (BarCount-Bars+20), DH, BarCount+35, DH, 1), "", colorLime, styleLine|styleThick|styleDots, Null, Null, 20);
PlotText("Buy Above " + DH + "; Stop Loss = " + DL, BarCount + 0, DH, colorBlack, colorLime);
Plot(LineArray(BarCount - (BarCount-Bars+20), (DH+ distance), BarCount+35, (DH+ distance), 1), "", colorLime, styleLine|styleThick|styleDots, Null, Null, 20);
PlotText("Target = " + (DH+ distance), BarCount + 0, (DH+ distance), colorBlack, colorLime);
Plot(LineArray(BarCount - (BarCount-Bars+20), DL, BarCount+35, DL, 1), "", colorOrange, styleLine|styleThick|styleDots, Null, Null, 20);
PlotText("Sell Below " + DL + "; Stop Loss = " + DH, BarCount + 0, DL, colorBlack, colorOrange);
Plot(LineArray(BarCount - (BarCount-Bars+20), (DL-distance), BarCount+35, (DL-distance), 1), "", colorOrange, styleLine|styleThick|styleDots, Null, Null, 20);
PlotText("Target = " + (DL-distance), BarCount + 0, (DL-distance), colorBlack, colorOrange);
}
function PlotIndicators()
{
SetChartOptions(0,chartShowArrows|chartShowDates);
/* Standard Error Bands */
Periods = Param("Standard Error", 80, 3, 200, 1);
Smooth = Param("Smooth",14,2,100,1);
LRCurve = LinearReg( C, periods );
MALRCurve = MA(LRCurve, Smooth);
SEValue = StdErr( C, periods );
SErrorAvg = MA(SEValue, Smooth);
LowerBand = MALRCurve - SErrorAvg ;
UpperBand = MALRCurve + SErrorAvg ;
Plot( MALRCurve , "MidBand", ParamColor("ColorMB",colorIndigo) , styleDashed|styleNoTitle);
Plot( LowerBand , "LowerBand", ParamColor("ColorLo",colorOrange) , styleLine|styleThick|styleNoTitle);
Plot( UpperBand , "UpperBand", ParamColor("ColorUp",colorGreen) , styleLine|styleThick|styleNoTitle);
Ch = TimeFrameGetPrice("C", in1Minute/60);
clr = IIf(Ch[BarCount-2] > Ch[BarCount-1],colorRed,colorLime);
Plot(LineArray(0,C[BarCount-1],BarCount-1,C[BarCount-1],15), "", Clr, styleLine|styleNoLabel, Null, Null, 30);
PlotText("CMP:" + C[BarCount-1], BarCount+5, C[BarCount-1],colorBlack,Clr);
LRPeriods = Param("Length", 40, 3, 200, 1);
LRCurve = LinearReg( C, LRPeriods );
PlotLR = IIf(LRCurve < LowerBand, (LRCurve + LowerBand)/2, IIf(LRCurve > UpperBand, (LRCurve + UpperBand)/2, LRCurve));
PlotLR = (PlotLR + SwingLine)/2;
//Plot( PlotLR , "Stop Loss |", ParamColor("SLColor",colorBlue), 4+8+32+2048);
//Plot( SwingLine, "SwingLine", ParamColor( "SWColor", colorBlue ), ParamStyle("StyleSW",style=styleThick|styleNoLabel , mask=maskDefault) );
bc1 = (Cross(C, MALRCurve) OR Cross(C, UpperBand) OR Cross(C, LowerBand)) AND (C > SwingLine);
bc2 = Cross(C, SwingLine) AND (C > MALRCurve OR C > UpperBand OR C > LowerBand);
sc1 = (Cross(MALRCurve, C) OR Cross(UpperBand, C) OR Cross(LowerBand, C)) AND (C < SwingLine);
sc2 = Cross(SwingLine, C) AND (C < MALRCurve OR C < UpperBand OR C < LowerBand);
Buy = bc1 OR bc2;
Sell = sc1 OR sc2;
Buy = ExRem(Buy, Sell);
Sell = ExRem(Sell, Buy);
//PlotShapes(shapeCircle*Buy + shapeCircle *Sell, IIf(Buy, colorBlue, colorRed), 0, IIf(Buy, L, H), IIf(Buy, -12, 12));
}
//PlotDT();
_SECTION_END();