need help for buy/sell signal

#1
Hi all,

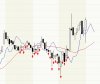
I want to show a buy signal on chart but it shows some false signal.

cMA is the value of 19 days simple moving average while pMA is the value

of 2 days simple moving average of the previous day.

I wanna show a buy signal when cMA is greater then pMA.

Here are my coding:

cMA = MA(Close,19);
pMA = ref(MA( Close, 2),-1);

Buy=cMA>pMA;

shape = Buy * shapeUpArrow;

Plot( Close, "Price", colorRed, styleCandle );

PlotShapes( shape, IIf( Buy, colorred, shapenone ), 0, IIf( Buy, Low, High ) );


Thanks for any advice or help~~:clap:
 

KelvinHand

Well-Known Member
#2
Hi all,

I want to show a buy signal on chart but it shows some false signals.

cMA is the value of 19 days simple moving average while pMA is the value

of 2 days simple moving average of the previous day.

I wanna show a buy signal when cMA is greater then pMA.

Here are my coding:

cMA = MA(Close,19);
pMA = ref(MA( Close, 2),-1);

Buy=cMA>pMA;

shape = Buy * shapeUpArrow;

Plot( Close, "Price", colorRed, styleCandle );

PlotShapes( shape, IIf( Buy, colorred, shapenone ), 0, IIf( Buy, Low, High ) );


Thanks for any advice or help~~:clap:

Your code is verified to what you want it to do, that are not the false signal.

Why I say is correct - take a look at your condition:-
=>"I wanna show a buy signal when cMA is greater then pMA."
This means that when pMA is below cMA, you are telling AMI to plot arrow every bar that pMA is below cMA.
Ami did according to your instruction - so nothing wrong .


But had you verify what you do is the right way?
What dont you plot both the cMA and pMA, check again and decide what is right ?
 
Last edited:
#3
Your code is verified to what you want it to do, that are not the false signal.

Why I say is correct - take a look at your condition:-
=>"I wanna show a buy signal when cMA is greater then pMA."
This means that when pMA is below cMA, you are telling AMI to plot arrow every bar that pMA is below cMA.
Ami did according to your instruction - so nothing wrong .


But had you verify what you do is the right way?
What dont you plot both the cMA and pMA, check again and decide what is right ?

Yes I plot cMA and pMA by the following:

Plot( MA( Close, 19 ), "cMA", colorRed, styleLine,Null,Null,5 );
Plot( ref(MA( Close, 2),-1), "pMA", colorBlue, styleLine,Null,Null,5 );

and it turns out this:


Even when the red line is under the blue line, there is buy signal...

That's why I said there are false signal...


Thanks!
 

Attachments

KelvinHand

Well-Known Member
#4
Yes I plot cMA and pMA by the following:

Plot( MA( Close, 19 ), "cMA", colorRed, styleLine,Null,Null,5 );
Plot( ref(MA( Close, 2),-1), "pMA", colorBlue, styleLine,Null,Null,5 );

and it turns out this:


Even when the red line is under the blue line, there is buy signal...

That's why I said there are false signal...


Thanks!
please check your plot() help guide properly what the 5 is doing.

Then remove the 5, and see what is happening.