how to draw multiple symbols in single window

#1
Dear all,

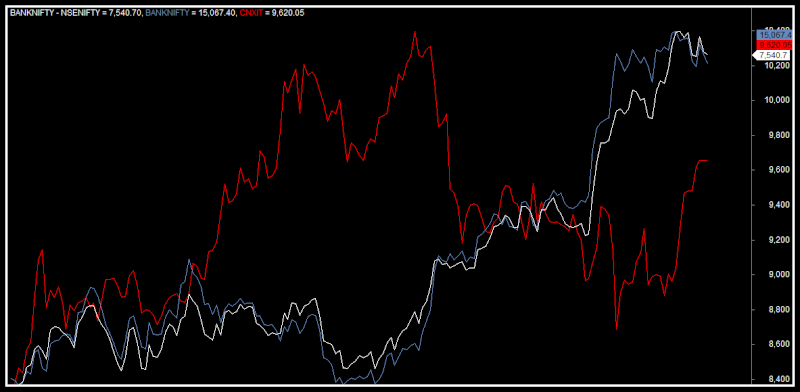
any one have a idea about "how to draw multiple symbols in single window in amibroker "

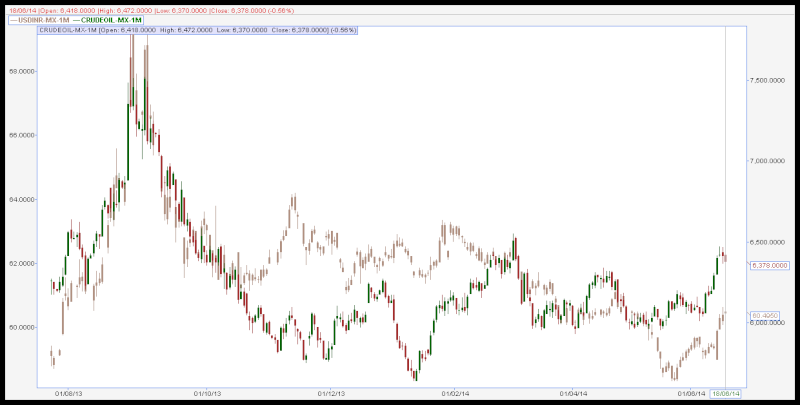
lets see i has plot "Crudeoil and Usdinr" both charts in single window using java chart.if i can apply same setup in amibroker ?.

its possible then kindly update, how to plot ? or if anyone have this related afl ?please share..it will be more helpful for better understand combine relationship for underlying.

 
#3
WOW , Finally i got it ... but its line chart...
any idea about plot chart type in candle ?

Create an indicator test.afl

Plot(Foreign("NSENIFTY","Close"),"NSENIFTY",2,styleOwnScale|1);
Plot(Foreign("BANKNIFTY","Close"),"BANKNIFTY",3,styleOwnScale|1);
Plot(Foreign("CNXIT","Close"),"CNXIT",4,styleOwnScale|1);

 
#4
so we can apply "options chart " also in nifty or banknifty MAIN price chart...

you can easily track option movements with nifty RT.

for Globaldatafeeds or qtx datafeed users::: example option ticker

Plot(Foreign("NIFTY14JUN7500PE","Close"),"NIFTY14JUN7500PE",2,styleOwnScale|1);
Plot(Foreign("NIFTY14JUN7600CE","Close"),"NIFTY14JUN7600CE",3,styleOwnScale|1);
 

amitrandive

Well-Known Member
#5
WOW , Finally i got it ... but its line chart...
any idea about plot chart type in candle ?

Create an indicator test.afl

Plot(Foreign("NSENIFTY","Close"),"NSENIFTY",2,styleOwnScale|1);
Plot(Foreign("BANKNIFTY","Close"),"BANKNIFTY",3,styleOwnScale|1);
Plot(Foreign("CNXIT","Close"),"CNXIT",4,styleOwnScale|1);

Managed only this

It changes only the Nifty price option through View-Price Chart Style.Tried for other symbols but it overlaps for candles.

Code:
Plot(Foreign("NSENIFTY","Close"),"NSENIFTY",2,ParamStyle("Style")|GetPriceStyle()|1);
Plot(Foreign("BANKNIFTY","Close"),"BANKNIFTY",3,styleOwnScale|1);
Plot(Foreign("CNXIT-I","Close"),"CNXIT-I",4,styleOwnScale|1);
 

Similar threads