


Code:
// code from http://goo.gl/jhlwO
SECTION_BEGIN("Free SuperTrend");
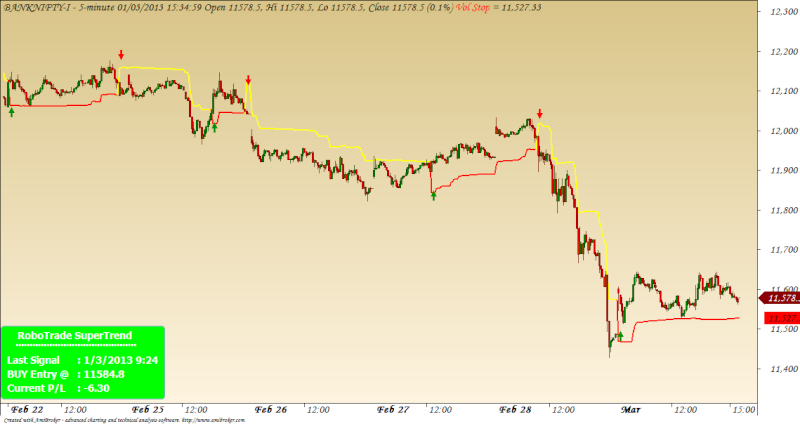
_N(Title = StrFormat("{{NAME}} - {{INTERVAL}} {{DATE}} Open %g, Hi %g, Lo %g, Close %g (%.1f%%) {{VALUES}}", O, H, L, C, SelectedValue( ROC( C, 1 ) ) ));
SetChartOptions(1,chartShowArrows|chartShowDates|chartWrapTitle);
GraphXSpace = 15;
SetBarFillColor(IIf(C>O,ParamColor("Candle UP Color", colorGreen),IIf(C<=O,ParamColor("Candle Down Color", colorRed),colorLightGrey)));
Plot(C,"",IIf(C>O,ParamColor("Wick UP Color", colorDarkGreen),IIf(C<=O,ParamColor("Wick Down Color", colorDarkRed),colorLightGrey)),64,0,0,0,0);
SetChartBkGradientFill( ParamColor( "TopColor", ColorRGB( 217, 197, 137 ) ), ParamColor( "BottomColor", ColorRGB( 254, 244, 224 ) ) );
//SetTradeDelays(1,1,1,1);
Period = Param("Period", 150, 1, 2400, 1);
mult = Param("Multiplier", 4, 1.1, 20.0, 0.1); // set for 5 minutes chart.
f=ATR(period);
VS[0] = Close[0];
trend[0] = 0;
HighC[0]=0;
Lowc[0]=0;
for( i = period+1; i < BarCount; i++ )
{
vs[i] = vs[i-1];
trend[i] = trend[i-1];
highC[i] = HighC[i-1];
lowc[i] = lowc[i-1];
if ((trend[i]>=0) && ( C[i] <VS[i] ))
{
trend[i] =-1;
HighC[i] = C[i];
lowc[i] = C[i];
}
if ((trend[i]<=0) && (C[i] >VS[i]))
{
trend[i]=1;
HighC[i] = C[i];
lowc[i] = C[i];
}
if (trend[i]==-1)
{
if (C[i]<lowc[i]) lowc[i] = C[i];
VS[i]= lowc[i]+ (mult*f[i]);
}
if (trend[i]==1)
{
if (C[i]>HighC[i]) HighC[i] = C[i];
VS[i]= HighC[i]-(mult*f[i]);
}
}
Plot(VS, "Vol Stop",IIf(trend==1,colorRed,colorYellow ),styleThick);
Buy=Cross(Trend,0);
Short=Cross(0, Trend);
Buy = Ref(Buy, -1);
Short = Ref(Short, -1);
Hp = HHV( H, 40 );
Lp = LLV( L, 40 );
BarsSincebuy = BarsSince( Buy );
BarsSinceshort = BarsSince( Short );
LastSignal = IIf( BarsSincebuy < BarsSinceshort, 1, -1 );
Sig = WriteIf( BarsSincebuy < BarsSinceshort, "BUY", "SELL" );
slPrice = IIf( LastSignal == 1, HighestSince( Buy, Lp ), LowestSince( Short, Hp ) );
initialrisk = IIf( LastSignal == 1, BuyPrice - SLPrice, SLPrice - ShortPrice );
CurrentPL = IIf( LastSignal == 1, C - BuyPrice, SellPrice - C );
BuyPrice=ValueWhen(Buy,O);
ShortPrice=ValueWhen(Short,O);
entry = IIf( LastSignal == 1, BuyPrice, ShortPrice );
PlotShapes(Buy * shapeUpArrow,colorGreen, 0,L, Offset=-45);
PlotShapes(Short * shapeDownArrow,colorRed, 0,H, Offset=-45);
bars = LastValue( IIf(BarsSincebuy < BarsSinceshort, BarsSincebuy, BarsSinceshort));
Offset = 15;
Clr = IIf(LastValue(LastSignal) == 1, colorGreen, colorRed);
if ( ParamToggle( "Message Board ", "Show|Hide", 1 ) )
{
GfxSelectFont( "Tahoma", 11, 700 );
GfxSetBkMode( 1 );
GfxSetTextColor( colorWhite );
if ( SelectedValue( LastSignal ) == 1 )
{
GfxSelectSolidBrush( colorBrightGreen );
Datetim = "" + ValueWhen( Buy, Day(), 1 ) + "/" + ValueWhen( Buy, Month(), 1 ) + "/" + ValueWhen( Buy, Year(), 1 ) + " " + ValueWhen( Buy, Hour(), 1 ) + ":" + ValueWhen( Buy, Minute(), 1 );
}
else
{
GfxSelectSolidBrush( colorOrange );
Datetim = "" + ValueWhen( Short, Day(), 1 ) + "/" + ValueWhen( Short, Month(), 1 ) + "/" + ValueWhen( Short, Year(), 1 ) + " " + ValueWhen( Short, Hour(), 1 ) + ":" + ValueWhen( Short, Minute(), 1 );
}
pxHeight = Status( "pxchartheight" ) ;
xx = Status( "pxchartwidth" );
Left = 1100;
width = 310;
x = 1.5;
x2 = 235;
y = pxHeight / 1;
GfxSelectPen( colorLightBlue, 1 );
GfxRoundRect( x, y - 105, x2, y , 7, 7 ) ;
GfxTextOut( ( "RoboTrade SuperTrend" ), 25, y - 100 );
GfxTextOut( ( " ..........................................." ), 18, y - 90 );
GfxTextOut( ( "Last Signal" ), 10, y - 65 ) ;
GfxTextOut( ( ": " + Datetim ), 110, y - 65 ) ;
GfxTextOut( ( "" + sig + " Entry @" ), 10, y - 45 );
GfxTextOut( ( ": " + entry ), 110, y - 45 );
GfxTextOut( ( "Current P/L" ), 10, y - 25 );
GfxTextOut( ( ": " + WriteVal( IIf( sig == "BUY", ( C - entry ), ( entry - C ) ), 2.2 ) ), 110, y - 25);;
x = 290;
x2 = 500;
}
_SECTION_END();