Custom study indicator - Augu Lines

augubhai

Well-Known Member
#1
Code:
//startDate = ParamDate("Start Date", "", 0);
//startTime = ParamTime("Start Time", "00:00:00", 0);
//endDate = ParamDate("End Date", "", 0);
//endTime = ParamTime("End Time", "00:00:00", 0);
extension = Param("Entension Period",5,0,500,1);
Color = ParamColor("Color",colorBlack);
sid = ParamStr("Linked Study ID", "AA");

x = BarIndex()+1;
//startx = LastValue(ValueWhen(DateNum() == startDate AND TimeNum() >= startTime AND (Ref(DateNum(),-1) < startDate OR Ref(TimeNum(),-1) < startTime), x)); 
startx = Lowest(ValueWhen(Study(sid, GetChartID()) > 0, x));
startx = IIf(startx == 0 OR startx==LastValue(x), 1, startx);
//endx = LastValue(ValueWhen(DateNum() == endDate AND TimeNum() >= endTime AND (Ref(DateNum(),-1) < endDate OR Ref(TimeNum(),-1) < endTime), x));
endx = LastValue(ValueWhen(Study(sid, GetChartID()) > 0, x));
endx = IIf(endx == 0 OR endx <=startx, LastValue(x), endx);
Periods = LastValue(endx - startx + 1);
intercept = LastValue(ValueWhen(x==endx, LinRegIntercept(Avg, Periods)));
slope = LastValue(ValueWhen(x==endx, LinRegSlope(Avg, Periods)));
y = intercept + slope * ( x - (endx - Periods + 1 ) );
WidthH = IIf( x > (endx - Periods) AND x <= endx, H-y, 0 );
WidthL = IIf( x > (endx - Periods) AND x <= endx, y-L, 0 );
MaxWidthH = LastValue(HHV(WidthH, 0));
MaxWidthL = LastValue(HHV(WidthL, 0));

RLU = IIf( x > (endx - Periods) AND x <= endx+extension, y+MaxWidthH , Null );
RLL = IIf( x > (endx - Periods) AND x <= endx+extension, y-MaxWidthL , Null );

Plot(RLU, "", Color);
Plot(RLL, "", Color);
 

augubhai

Well-Known Member
#2
The reason i posted the above code, is because it shows how to use an indicator like a study...

This is really just a modification of Raff Regression Channel, but gives us the option of defining the Channel as we please (instead of just Raff, Standard Deviation, and Standard Error that are present in the standard Amibroker study)

To use this indicator
1. Drag this indicator onto the price chart.
2. Set the "Linked Study ID" parameter to a 2 letter combination. (Default is set to "AA").
3. Drag any Trendline study onto the chart and set the Trendline's Study ID to the same 2 letter combination.

The indicator will only be visible if the Linked Study ID is present. You can drag the linked Study, and the indicator will repaint.
 
#3
Code:
//startDate = ParamDate("Start Date", "", 0);
//startTime = ParamTime("Start Time", "00:00:00", 0);
//endDate = ParamDate("End Date", "", 0);
//endTime = ParamTime("End Time", "00:00:00", 0);
extension = Param("Entension Period",5,0,500,1);
Color = ParamColor("Color",colorBlack);
sid = ParamStr("Linked Study ID", "AA");

x = BarIndex()+1;
//startx = LastValue(ValueWhen(DateNum() == startDate AND TimeNum() >= startTime AND (Ref(DateNum(),-1) < startDate OR Ref(TimeNum(),-1) < startTime), x)); 
startx = Lowest(ValueWhen(Study(sid, GetChartID()) > 0, x));
startx = IIf(startx == 0 OR startx==LastValue(x), 1, startx);
//endx = LastValue(ValueWhen(DateNum() == endDate AND TimeNum() >= endTime AND (Ref(DateNum(),-1) < endDate OR Ref(TimeNum(),-1) < endTime), x));
endx = LastValue(ValueWhen(Study(sid, GetChartID()) > 0, x));
endx = IIf(endx == 0 OR endx <=startx, LastValue(x), endx);
Periods = LastValue(endx - startx + 1);
intercept = LastValue(ValueWhen(x==endx, LinRegIntercept(Avg, Periods)));
slope = LastValue(ValueWhen(x==endx, LinRegSlope(Avg, Periods)));
y = intercept + slope * ( x - (endx - Periods + 1 ) );
WidthH = IIf( x > (endx - Periods) AND x <= endx, H-y, 0 );
WidthL = IIf( x > (endx - Periods) AND x <= endx, y-L, 0 );
MaxWidthH = LastValue(HHV(WidthH, 0));
MaxWidthL = LastValue(HHV(WidthL, 0));

RLU = IIf( x > (endx - Periods) AND x <= endx+extension, y+MaxWidthH , Null );
RLL = IIf( x > (endx - Periods) AND x <= endx+extension, y-MaxWidthL , Null );

Plot(RLU, "", Color);
Plot(RLL, "", Color);
error in this code....plz guide
 

augubhai

Well-Known Member
#4
no error,its working fine but u follow the 2nd post guidelines...
dear aghubhai,
what's the use of this indication, i checked ,its look like reg-channel...normal reg channel plat automatic..but this plat as per our studyline..? is it right..?

happy smile...
Yes, you are right. This code is just an example of how to use an indicator like a study. By that I mean that you can stretch or reposition the indicator by dragging the linked study on the chart.

Fro example, you can change the formula to calculate the WidthH, WidthL, MaxWidthH, MaxWidthL, etc.
Or instead of Linear Regression, you could modify the code to use - say something like a Moving Average - for example you want to calculate the average of the last hour only

Modify the code and use the indicator like a study!!
 

augubhai

Well-Known Member
#8
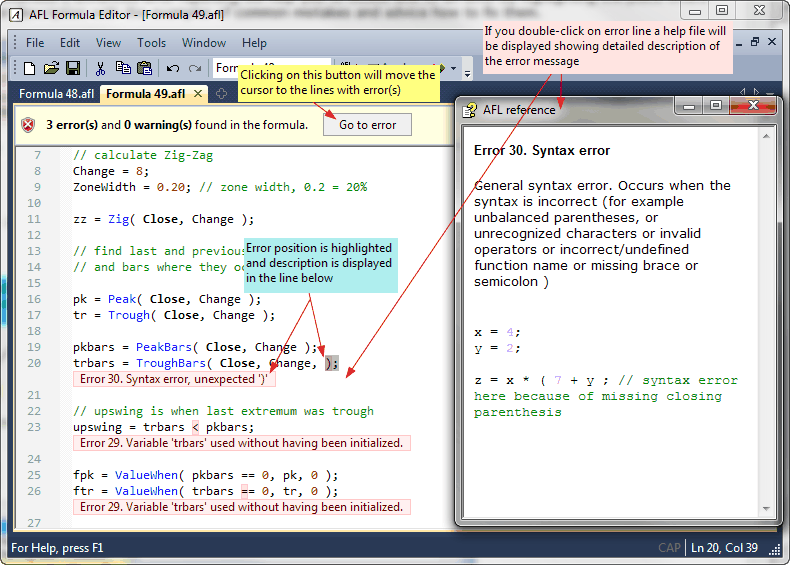
It will help if you could give some details of the error message. The error message details can be found by clicking on the "Verify Syntax" (tick mark) button in the Formula Editor.

See the image - the error details show up in the bottom of the window


At this point, I can only guess that 'slope' and 'intercept' maybe keywords in 5.6, or that you have combined this indicator with some other conficting code...
 

Similar threads