


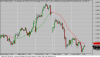
FlipIt indicator
I have seen FliIt indicator at GCI Financials CFD Share Trading Demo. The indicator is here in AFL form
_SECTION_BEGIN("Price");
SetChartOptions(0,chartShowArrows|chartShowDates);
SetBarsRequired(sbrAll,sbrAll);
SetBarFillColor(IIf(C>O,ParamColor("Candle Up Color", colorBrightGreen),IIf(C<=O,ParamColor("Candle Down Color", colorRed),colorLightGrey)));
Plot(C,"Price",IIf(C>O,ParamColor("Shadow Up Color", colorBlack),IIf(C<=O,ParamColor("Shadow Down Color", colorBlack),colorLightGrey)),64,0,0,0,0);
SetChartBkColor(ParamColor("Panel Color ",colorLightGrey));
SetChartBkGradientFill(ParamColor("Upper Chart",colorLightGrey),ParamColor("Lower Chart",colorLightGrey));
grid_day = IIf(Day()!=Ref(Day(),-1),1,0);
Plot(grid_day,"",colorWhite,styleHistogram|styleDots|styleNoLabel|styleOwnScale);
_N(Title = StrFormat("{{NAME}} - {{INTERVAL}} {{DATE}} Open %g, Hi %g, Lo %g, Close %g (%.1f%%) {{VALUES}}", O, H, L, C, SelectedValue( ROC( C, 1 ) ) ));
Plot( C, "Close", ParamColor("Price Color", colorBlack ), styleNoTitle | ParamStyle("Price Style") | GetPriceStyle() );
_SECTION_END();
t=Param("t", 24, 1, 100, 1);
Top = Sum(High, t) / t;
Bottom = Sum(Low, t) / t;
av=(Top+Bottom)/2;
mc=IIf(av>C, colorRed, colorGreen);
Plot(av, "", mc, styleStaircase);
Attachments
-
 10.5 KB Views: 590
Last edited:
")
