


Hello everyone,
I designed simple Stochastic trading system just to check how good results can I get from this simple indicator. However I am getting confused after results of optimization. In sample period - 1/1/2008 - 1/3/2008 and out-of-sample three months. I use exhaustive method of optimization.
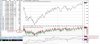
Amibroker by default creates Equity Lines of In-sample and Out-of-sample walk forward. The problem is that the Equity Line differs from detailed report generated at the end of tests. At equity I get Out-of-sample net profit of . At spreadsheet I get .
I'm running my test on futures contracts for WIG20 (Warsaw Stock Exchange).
Data is for download here: http://stooq.pl/q/d/l/?s=fw20&i=d
I attach AFL code so you could get a better view into system.
There is a part for generating trailling-stop I got from here: http://www.amibroker.com/kb/2007/03/24/how-to-plot-a-trailing-stop-in-the-price-chart/
The problem is that sometimes at equity curve I get fractions of gains what is simply impossible. The minimum change of our futures contracts is 1 point and the commissions are also 1 point for buying or selling contract. Perhaps something is messed up in the curve?
Thank you very much for any help.
I designed simple Stochastic trading system just to check how good results can I get from this simple indicator. However I am getting confused after results of optimization. In sample period - 1/1/2008 - 1/3/2008 and out-of-sample three months. I use exhaustive method of optimization.
Amibroker by default creates Equity Lines of In-sample and Out-of-sample walk forward. The problem is that the Equity Line differs from detailed report generated at the end of tests. At equity I get Out-of-sample net profit of . At spreadsheet I get .
I'm running my test on futures contracts for WIG20 (Warsaw Stock Exchange).
Data is for download here: http://stooq.pl/q/d/l/?s=fw20&i=d
I attach AFL code so you could get a better view into system.
There is a part for generating trailling-stop I got from here: http://www.amibroker.com/kb/2007/03/24/how-to-plot-a-trailing-stop-in-the-price-chart/
The problem is that sometimes at equity curve I get fractions of gains what is simply impossible. The minimum change of our futures contracts is 1 point and the commissions are also 1 point for buying or selling contract. Perhaps something is messed up in the curve?
Thank you very much for any help.
Attachments
-
 97.5 KB Views: 59